VnCommEx
Hợp tác xuất khẩu SUBSCRIBE
VnCommEx
Hợp tác xuất khẩu SUBSCRIBE
  • VCE
  • Product Catalogue
  • Market Insight
    • Wood & Furniture
    • Garment & Footwear
    • Food & Spicy Industry
    • Fruit & Vegetable
    • Others
    • Market Insights
  • Vietnam Market
    • Vietnam Commodity Market Price
    • Vietnam Export Data
    • Vietnam in FTA
  • Publication
  • About Us
  • English
    • 中文 (中国)
    • Tiếng Việt
VnCommEx
VnCommEx
  • VCE
  • Product Catalogue
  • Market Insight
    • Wood & Furniture
    • Garment & Footwear
    • Food & Spicy Industry
    • Fruit & Vegetable
    • Others
    • Market Insights
  • Vietnam Market
    • Vietnam Commodity Market Price
    • Vietnam Export Data
    • Vietnam in FTA
  • Publication
  • About Us
  • English
    • 中文 (中国)
    • Tiếng Việt
All Right Reserved. Designed and Developed by PenciDesign
Fruit & Vegetable

Vietnam’s fruit and vegetable exports: Key markets, challenges, and opportunities

by Henry Truong October 5, 2024
written by Henry Truong

In the first four months of 2024, the total export turnover of agricultural products reached 10.44 billion USD, marking a 32.5% increase compared to the same period in 2023. Notably, the export turnover of vegetables and fruits amounted to 2.49 billion USD, reflecting a 25.7% increase over the same period in 2023. This achievement is unprecedented since the initiation of the economic renewal campaign in 1986, with Vietnamese fruits and vegetables surpassing the 1 billion USD mark in the first quarter of the year for the first time.

Which Vietnamese fruits are exported the most?

Durian has emerged as Vietnam’s leading fruit export, surpassing dragon fruit in 2023 with a remarkable $2.2 billion in revenue, representing a fourfold increase from 2022 and comprising 40.7% of total fruit and vegetable exports. Following durian, dragon fruit contributed $613 million (11.1%), bananas $308 million (7.6%), and jackfruit and mangoes accounted for 5.9% and 4.3% respectively of the total export value.

The first quarter of 2024 also saw significant growth in new fruit categories, with coconut exports up 112.6%, longan by 159.9%, macadamia nuts by 113.9%, and almonds by 274.4%. Although Vietnam ranks fifth globally in coconut production, its export value has yet to reach $1 billion. However, the recent growth signals a positive outlook for coconut exports, especially in the cosmetic and health industries.

By the end of 2024, fruit output is projected to exceed 13.5 million tons, a 3.4% increase from 2023, while vegetable output is estimated at 19.7 million tons, rising by about 624,000 tons. This growth is particularly impressive considering the severe heatwaves from El Niño that affected Southeast Asia for up to five months, highlighting the agricultural sector’s resilience.

Where does Vietnam export most of its fruits and vegetables?

Currently, China stands as the primary export market for Vietnamese fruits and vegetables, accounting for 61.4% of total exports and generating $2 billion, a significant 128.5% increase compared to the same period in 2022. The General Administration of Customs of China has approved 3,140 product codes for Vietnamese agricultural products, encompassing 12 key items such as watermelon, mangosteen, durian, fresh bananas, and dragon fruit, with frozen durian and coconut also under consideration for approval.

In 2023, Vietnamese vegetable exports to the U.S. reached $140.5 million, a decline of 11.2% compared to the previous year. Exports to South Korea grew by 13% to $125.1 million, while exports to Japan increased by 5.5% to $105.6 million. Despite the high demand for imported fruits and vegetables in these markets, Vietnamese products maintain a relatively small market share compared to other exporters.

For example, the U.S. imports $46-50 billion worth of fruits and vegetables annually, with Vietnam contributing only 0.6%-0.7% of that total. Similarly, Vietnam’s fruits and vegetables account for less than 5% of South Korea’s $4 billion annual imports.

In the EU market, Vietnam’s agricultural products represent about 4% of the total annual import value, which exceeds $160 billion. The Vietnam-EU Free Trade Agreement (EVFTA), in effect since August 2020, aims to boost Vietnam’s agricultural exports by gradually eliminating tariffs over a 10-year period, improving market access and competitiveness

Maybe you will like:

  • Vietnam’s Coffee Industry: A Global Coffee Export Powerhouse
  • Vietnam Dragon Fruit: Gradually Regaining Global Leadership

Source: Center for digital transformation and agricultural statistics – Ministry of Agriculture and Rural Development

What are the biggest challenges for Vietnam’s fruit and vegetable exports?

Why is relying on fresh produce a challenge for Vietnamese exports?

A significant challenge for Vietnam’s fruit and vegetable exports stems from the fact that 80% of these products are exported fresh, with processed items like mangoes, passion fruit, and canned fruits making up only 20%. Despite having 150 modern processing plants with a combined capacity of 1.1 million tons per year, this heavy reliance on fresh produce creates two primary hurdles for sustained growth and market competitiveness.

Quality Management and Post-Harvest Losses: Small-scale, fragmented production leads to difficulties in quality management and traceability. Inadequate preservation and packaging technology result in high post-harvest losses, ranging from 20% to 30% of total production, increasing selling prices.

Logistic Challenges: Long shipping times hinder increasing export volumes to the EU, Australia, and the US. Shipping fresh produce from Vietnam takes 25 days to Australia, 40-45 days to the US, and 30-35 days to the EU. Without enhancing the processing industry, Vietnam will struggle to increase export volumes, especially for fresh vegetables with limited shelf life.

Additionally, the procurement system involves many intermediaries, leading to high costs and reduced competitiveness. The lack of synchronized warehouse systems and logistics services exacerbates this issue. Vietnam’s processing industry also faces constraints in production capacity, product variety, and quality standards. Investment in technology, machinery, and equipment is crucial to enhance competitiveness and enable processed fruit and vegetable products to access the EU market effectively.

How do farming techniques impact Vietnamese fruit and vegetable exports?

While Vietnamese farmers have shown adaptability in shifting from rice cultivation to more profitable perennial industrial crops and fruit trees, weaknesses in farming techniques in newly expanded areas significantly impact export quality and productivity. Farmers often lack essential knowledge in garden design, canopy management, and proper care, leading to delayed fruiting and reduced yields. Furthermore, inadequate pest and disease management techniques contribute to lower fruit quality, posing a challenge for meeting stringent international export standards.

Particularly with durian, in regions with challenging soil conditions such as saline soil and inadequate irrigation, improper care can hinder plant development, leading to poor growth and a high mortality rate among plants, causing significant losses for farmers and exports.
Impact of weather conditions and climate
In addition to technology and production scale, Vietnam faces significant challenges posed by climate change, storms, increasing inland salinity intrusion, and prolonged droughts, all of which adversely affect crop areas and yields.

In 2024, the prolonged El Nino phenomenon, lasting nearly six months, exacerbated widespread drought and saltwater intrusion across many parts of Vietnam. By April 15, 2024, over 2,000 hectares of crops in Dak Lak province had already been impacted by the prolonged drought. The province, which boasts 858 irrigation works, has seen 44 reservoirs completely dried up and 139 reservoirs operating below 50% capacity. Meanwhile, in the Mekong Delta, a region crucial for nearly 70% of the country’s fruit production, concerns arose as water levels in rivers and canals fell critically low, unable to meet the demands for household, agricultural, and industrial use. Fortunately, by June 2024, conditions had begun to improve, offering Vietnam a valuable lesson in preparing for increasingly complex weather patterns in the future.

Moreover, Vietnam’s vegetable and fruit sectors are significantly influenced by these climatic variations. For example, unlike the Mekong Delta, where durian cultivation can control flowering throughout the year, regions like the Southeast and Central Highlands heavily rely on annual weather patterns for flowering cycles. This dependency results in substantial variability in durian harvesting seasons in these areas, ranging from April to October, with an off-season extending from November to March the following year. Thus, while the Mekong Delta manages to stagger durian harvests effectively, other regions face greater unpredictability due to climate-induced fluctuations in agricultural cycles.

What quality control issues affect Vietnam’s fruit and vegetable exports?

Ensuring product quality and navigating stringent licensing requirements pose significant challenges for Vietnam’s fruit and vegetable exports. In January 2024, the European Union placed five Vietnamese agricultural products, including durian and dragon fruit, under increased scrutiny due to 170 warnings issued between 2020 and June 2023. These warnings primarily concerned pests, diseases (28 instances), and issues with plant quarantine certificates (133 instances), highlighting the critical need for enhanced quality control and compliance to meet international standards.

Regarding durians, in the last six months of 2023, Vietnam had three consignments of durians weighing over one tonne each that violated EU regulations. This is why Vietnam’s “king of fruits” has been placed under scrutiny.

Not only in the EU, but durian also faces “yellow card” scrutiny from China. Thirty consignments of Vietnamese durians exported to China were flagged for exceeding the allowable limit of cadmium heavy metal, as per China’s food safety regulations. According to the Plant Protection Department, the main cause of this cadmium contamination in 30 consignments of Vietnamese durians has yet to be determined. Durians may be contaminated with heavy metals during cultivation due to contaminated soil, from water sources and air pollution by factory emissions, or during harvesting when people use untreated water to process durians.

Certainly, these are just cautionary measures, and while there will be challenges, they also present an opportunity for high-quality Vietnamese products to assert their position in markets such as China or the EU, especially with the considerable support in trade tariffs for exports.

What solutions is Vietnam implementing to boost fruit and vegetable exports?

To address the identified challenges and enhance its position in global agricultural trade, the Vietnamese government is implementing comprehensive solutions focused on developing the agro-forestry-fishery processing industry and mechanizing agricultural production. The ambitious goal is for Vietnamese agriculture to be among the top 15 most developed countries by 2030, with its agro-processing industry ranking among the top 10 globally, establishing Vietnam as a key hub for deep processing and logistics in the international agricultural market.

The government aims to:

  • Restructure agriculture towards large-scale commodity production linked to processing and market consumption.
  • Promote the development of large fields with comprehensive mechanization throughout the agricultural value chain.
  • Invest in the development of the machinery manufacturing industry and supporting equipment for agriculture with a focus on specialization.
  • Establish and develop a synchronized logistics system to enhance the value and competitiveness of agricultural products.
  • Increase the application and transfer of scientific and technological advances in processing and preserving agricultural products.
  • Train specialized technical personnel and management workforce for the development of mechanization and the agro-processing industry.
  • Continue to deepen international economic integration and diversify export markets.

From 2018 to 2023, Vietnam remained the largest exporter to the USA market in Southeast Asia. Vietnam’s export growth rate in 2022 exceeded 100% compared to 2018, while other countries only maintained stable growth rates from 5% to 30%. Although Vietnamese products still have areas needing improvement, their quality and competitive pricing create trust in the US market. With continued technological innovation, Vietnam has ample opportunities to become one of the world’s leading export partners for vegetables and agricultural products.

Vietnamese agricultural products, particularly fruits and vegetables, are diverse and high-quality due to the country’s tropical monsoon climate and extensive 3,260-kilometer coastline. The mountainous regions in Vietnam have a temperate climate suitable for growing a wide variety of crops popular in Europe and the US. However, to comply with export requirements, especially regarding chemical fertilizer content, it is essential to conduct thorough reviews and closely follow procedures to prevent losses and additional costs.

Maybe you will like:

  • Vietnam’s Timber Industry 2024: Overview, opportunities, risks and challenges
  • From Craft to International Brand: Vietnamese Bamboo and Rattan Weaving Journey
October 5, 2024 0 comment
0 FacebookTwitterLinkedinWhatsapp
Garment & FootwearVietnam Export Data

Vietnam Footwear Export Value 2011 – 2025 (October Updated)

by Henry Truong October 4, 2024
written by Henry Truong

Vietnam Footwear Export Value 2011 – 2025 (October Updated)

  • Raw data from the General Department of Vietnam Customs
  • Unit: USD Millions
Country20112012201320142015201620172018201920202021202220232024

10M

2025

Oct-25
Grand Total6456.737172.618290.2510069.211842.0112824.4914461.4816062.4818106.2816587.4217470.0223512.519961.682258819826.52032.2
United States1907.62242.992627.013328.434076.484482.595112.55822.696645.526299.277422.689617.947161.848286.797389.66705.75
China252.61300.74354.74504.81754.09904.721140.571491.831780.332071.061591.51707.161867.341912.251307.47113.59
Belgium356.69404.65516.47659.04723.45825.36907.22976.931160.84988.21130.631639.221207.981323.451028.5121.65
Japan248.89328.34388.33518.97597.58674.79751.01852.69973.21848.41806.791093.841048.361088978.43102.42
Netherlands367.17347.54359.23469.85533.65594.99582.79639.99741.89683.09713.871064.291003.861669.891490.27162.8
Germany410.26400.23457.28600.06705.33764.34992.48943.751004.93891.23840.641292.91942.93767.56598.6167.71
United Kingdom494.95501.28543.24572.35693.47618.28688.79640.46628.57498.86545765.01794.61995.52885.2693.65
South Korea151.51182.62231.33294.5302.21344.94402.61493.99604.61548.58503.42651.02626.63660.42501.9735.44
France244.87237.92228.01253.37417.18449.9511.06488.9513.24423.39450.75634.7518.97565.7153352.11
Canada112.58133.49160.44188.33216.84252.87292.23330.18391.15350.52368.05604.64469.48542.7526.0662.98
Mexico205.56212.73228.46227.81229.53256.84288.57274.42306.82238.21315.06411.66425.3538.91595.1863.05
Spain238.31234.5296.77382.46281.87266.76258.11264.09234.93175.53216.72344.23405.63516.3433.9439.62
Australia68.8795.1108.83142.08176.94209.11225.33253.92296.77288.57309.71438.65391.22411.77372.6844.3
Italy249.4225.7240.03313.86346.25335.71306.89317.84308.55245.34274.83420.15366.59461.33475.8458.17
UAE33.5845.3759.470117.46124.67123.86116.2615499.65124.43201.85216.24220.42208.7527.53
Taiwan60.1466.7679.0984.9117127.36135.63135.26155.72153.51144.21188.48185.76192.5122.9810.17
India19.4626.0930.6335.0533.6846.0467.91103.54129.9196.14113.46223.35182.89130.9289.7813.37
Brazil181.52249.3296.42266.1208.66158.34171.28168.12178.52147.13121.48156.92167.79181.15194.8520.34
Turkey23.2122.4431.7734.5844.6441.4334.7536.7536.2243.6234.4596.93150.03176.37113.0917.36
Singapore22.3125.9133.2436.2945.9547.9467.4678.5287.3475.1987.01126.86132.47124.7391.8110.1
Hong Kong79.787.83106.56134.86165.06166.83176.4186.55194.98138.25115.58156.54130.05113.4389.57.45
Chile64.7764.978.33116.73108.09125.43136.67141.63129.3392.9127.35167.37123.9148.75145.4819.37
South Africa61.8768.5381.391.98109.41117.45105.52108.79105.6782.1195.56141.78110.79115.9999.4410.33
Panama120.89128.01123.47125.89127.73111.37116.51116.38129.0280.273.12136.38109.85118.32119.3412.52
Malaysia27.725.6536.3840.5350.0151.9852.1264.0670.3650.9645.9481.43104.69120.5485.556.46
Philippines17.2320.2422.7231.443.1746.4755.2858.8772.7550.6731.7474.67104.67107.289.876.16
Indonesia12.2917.7621.2722.2223.7830.0144.7261.1777.8655.3949.6576.1599.54114.64106.268.91
Thailand15.1317.825.8423.2129.240.8946.9365.8873.7959.653.8969.0699.38109.2495.27.34
Argentina51.9626.9241.8843.3441.1864.2681.489.5570.2544.3352.7272.4591.43105.31139.888.24
Peru000000060.9967.8147.665183.8390.4480.8880.6510.25
Czech Republic24.9434.5733.4741.2553.7445.2651.2856.3580.8479.8591.9991.8376.2197.6874.211.7
Luxembourg000000016.5812.5229.0139.6478.5375.9160.3140.724.81
Poland7.4515.3912.7621.423.822.8631.3839.6141.6538.0344.2164.0574.0990.1988.8114.44
Israel1313.518.3731.3137.3236.8743.4541.8251.1242.9161.2992.364.4975.1464.798.9
Sweden41.6953.754.9841.2245.2343.3252.6169.5371.3572.173.6105.9655.3768.6567.0810.39
New Zealand11.9416.9418.0922.0426.3727.9728.6130.3340.3739.9549.362.4954.1256.8643.246.44
Switzerland22.4727.4924.1419.8618.4518.4220.8328.6832.9127.3725.0336.3231.6922.5521.242.97
Austria68.0956.7455.9450.5932.534.2433.5425.9125.7118.6417.9727.8530.7425.0321.43.39
Colombia000000021.426.2620.4719.5137.8330.630.9935.124.64
Denmark29.928.7128.6542.7653.9146.5744.4333.7728.9210.7410.7736.4126.2122.4420.852.17
Greece23.1617.3118.6326.1227.5631.9330.4729.0730.4424.3518.2527.9623.9324.0922.622.33
Russia62.0168.699.5287.277.24103.53101.98122.27165.65162.98139.9751.8720.6115.3717.871.69
Romania00000000000016.9121.6617.691.98
Ukraine6.296.946.655.625.197.137.739.4312.3414.5216.869.1214.1921.1121.582.81
Norway14.3916.9318.812.4212.9615.8418.4418.6318.1620.9425.2934.9913.920.7216.151.36
Slovakia24.4968.8385.88107.4288.9988.6297.82105.17112.8694.73.323.535.8715.211.911.51
Kazakhstan0000000000004.576.296.710.68
Finland3.994.044.1913.2214.3216.5217.3421.5622.2618.8218.597.593.484.725.610.85
Portugal1.881.621.651.742.581.853.075.875.293.022.152.8133.143.470.51
Cyprus0000000000002.341.81.060.08
Hungary0002.021.951.851.912.492.751.451.041.571.972.151.170.38
Armenia0000000000000.480.510.190
Iceland0000000000000.350.430.60.17
See more:
  • Vietnam Textile And Garment Export Value 2011 – 2025
  • Vietnam Timber Product Export Value 2011 – 2025
October 4, 2024 0 comment
0 FacebookTwitterLinkedinWhatsapp
Fruit & Vegetable

Vietnam Dragon Fruit: Gradually Regaining Global Leadership

by Henry Truong October 4, 2024
written by Henry Truong

Which Vietnamese provinces are major dragon fruit growing regions?

Dragon fruit is mainly cultivated in provinces such as Binh Thuan, which accounts for 50.73% of the nation’s planting area, followed by Tien Giang (16.42%) and Long An (15.15%). The white-fleshed variety is predominantly grown in Binh Thuan, covering about 55% of the area. In contrast, the red-fleshed variety is mostly cultivated in Tien Giang and Long An, covering 40% of the total planting area.Chau Thanh District in Long An Province is widely recognized as a top-quality dragon fruit growing area in Vietnam, with a cultivation area of 6,800 hectares, where 100% of the output is red-fleshed dragon fruit. Chau Thanh’s dragon fruit is characterized by its sweet pink skin, vibrant green shoots, and sweet taste, all produced in compliance with VietGAP and GlobalGAP standards. The route from Chau Thanh, Long An to Cho Gao, Tien Giang, is often referred to as the “dragon fruit export highway” due to the presence of hundreds of businesses. Each day, hundreds of trucks and containers transport red-fleshed dragon fruit to international markets, particularly in China.
Long An Province, and especially Chau Thanh, has set a target of achieving 6,000 hectares of high-tech dragon fruit cultivation by the end of 2025. As of July 2024, the area has already reached 5,700 hectares. This progress highlights the determination of Long An farmers to preserve the fruit that has significantly improved their livelihoods, while also creating opportunities to expand export markets and avoid the sharp decline witnessed during 2022 and 2023.

See more: Comparison of Vietnam dragon fruit varieties

What challenges has Vietnamese dragon fruit faced in recent years?

The year 2017 was a pivotal moment for Vietnamese dragon fruit, as exports exceeded $1 billion for the first time. This strong position was maintained from 2017 to 2021, but by 2022 and 2023, export turnover dropped sharply by 50%, to just over $600 million.
The decline can be attributed to several factors. First, the global trend during this period saw countries limiting imports due to the complex challenges posed by COVID-19. Furthermore, in 2021, China successfully produced 1.6 million tons of dragon fruit annually, becoming the country with the world’s largest dragon fruit cultivation area. As China began to meet its own domestic demand, it reduced dragon fruit imports by 25% over the past three years, significantly impacting the export volumes of other producing countries.

Understand the strength of Dragon fruit in Vietnam by this article: Import Dragon Fruit from Vietnam. A Guide for International Buyers

Which international markets import Vietnamese dragon fruit?

Vietnam is currently one of the leading countries in Asia in terms of dragon fruit cultivation area and output. Vietnamese dragon fruit is exported to 40 countries and territories, with the main consumer markets being in Asia. China remains the largest and most traditional market, followed by Singapore, Hong Kong (China), and Indonesia. In recent years, Vietnam has also entered new high-potential markets, such as Japan, South Korea, the EU, the United States, and Australia.
According to data from the General Department of Customs, the export turnover for all forms of dragon fruit (including fresh, frozen, dried, and juice) is projected to continue declining in 2024, extending the downturn that began in 2023. In the first half of 2024, dragon fruit exports totalled $298.4 million, a 13.5% decrease compared to the same period in 2023. China, the most affected market, saw a 26% drop in revenue, totalling $203 million in the first half of 2024. Since China accounts for 70% of Vietnam’s dragon fruit export turnover, this reduction had a significant impact on the overall export figures.
However, there are some positive developments in other areas. One highlight is the sharp increase in processed dragon fruit exports. In the first six months of 2024, Vietnam’s dried dragon fruit exports reached $6.3 million, an astonishing rise of nearly 6,000% compared to last year. Moreover, while exports to China continue to decline, other markets have shown notable growth.

India saw a 35% increase, the US 89%, South Korea 36%, and the UAE 59%, signalling a more promising future for Vietnam’s dragon fruit exports in the coming years. Notably, the US, the world’s second-largest dragon fruit importer, has steadily increased its imports, even as China has reduced its purchases. Over the last three years, US imports of dragon fruit have risen by 43.6%.

India, with its 1.3 billion population, is another key market. Over the past five years, Vietnamese dragon fruit exports to India have grown tenfold, from $1 million in 2015 to $10 million in 2020, and continue to rise. Vietnam now accounts for 52% of India’s total dragon fruit imports. Indian consumers have developed a strong preference for dragon fruit, with import volumes increasing by 358% over the last three years, making India the country with the highest growth rate in dragon fruit imports worldwide.

How is Vietnam ensuring high-quality dragon fruit for export?

Vietnam is ensuring high-quality dragon fruit for export by leveraging its ideal land and climate for cultivation, alongside advanced techniques to extend the harvest season. Through the strategic use of lighting, Vietnamese dragon fruit can now be harvested year-round, with a peak season from April to September and an off-season from October to March. This extended harvesting capability provides a significant competitive edge in the global market, supporting the potential for increased export value and consistent supply in the coming years.

Binh Thuan Province, one of the largest dragon fruit-producing regions in Vietnam, covers 27,000 hectares with an annual output of approximately 550,000 tons. Currently, Binh Thuan has 653 coded dragon fruit growing areas and around 325 packaging facilities with codes. This proactive approach to coding for both growing areas and packaging facilities helps farmers and businesses enhance their awareness of food safety and plant quarantine standards. It also strengthens production supervision, ensuring compliance with proper processes, which stabilizes product quality and builds trust with importing countries.

CONCLUSION

Vietnam remains a global leader in dragon fruit production, leveraging its natural advantages in land and climate to maintain a strong presence in international markets. Despite facing challenges such as declining exports to China and the impact of COVID-19, Vietnam continues to expand its export reach to new markets like the U.S., India, South Korea, and the UAE. Thanks to advanced cultivation techniques, the country’s ability to produce dragon fruit year-round offers a competitive advantage that supports the future growth of export value.

Key provinces like Binh Thuan and Long An are actively investing in quality control through the implementation of growing area and packaging codes, ensuring consistent product standards that meet the requirements of global importers. With efforts to expand high-tech cultivation and diversify export markets, Vietnam is poised to strengthen its position as a top dragon fruit exporter. However, continuous improvements in product quality and adherence to global standards will be critical for maintaining this leadership amidst increasing competition and shifting market dynamics.

October 4, 2024 0 comment
0 FacebookTwitterLinkedinWhatsapp
Vietnam Export Data

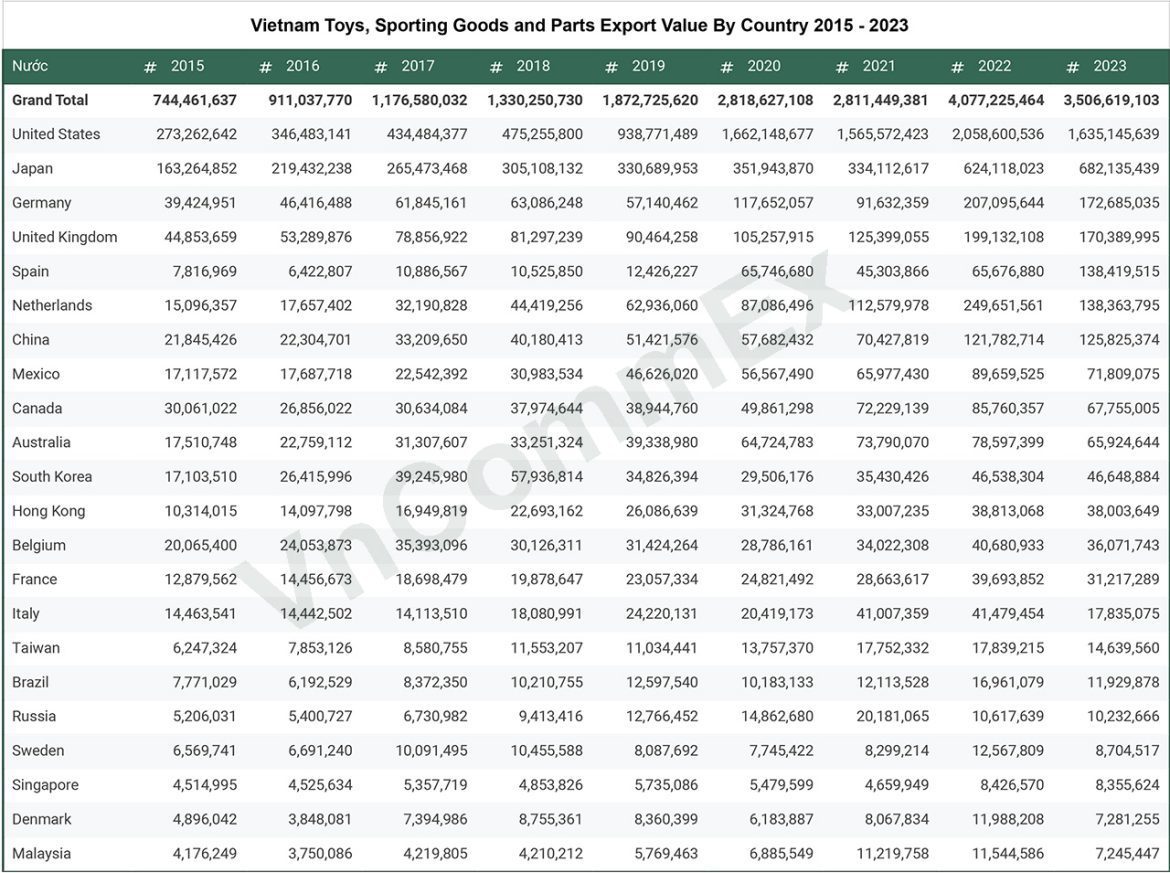
Vietnam Toys, Sporting Goods and Parts Export Value 2015 – 2025 (October Updated)

by Henry Truong October 3, 2024
written by Henry Truong

Vietnam Toys, Sporting Goods and Parts Export Value 2015 – 2025 (October Updated)

  • Raw data from the General Department of Vietnam Customs
  • Unit: USD Millions
Country201520162017201820192020202120222023202410M 2025Oct-25
Grand Total744.46911.041176.581330.251872.732818.632811.454077.233506.623548.43

7514.02

961.6

United States273.26346.48434.48475.26938.771662.151565.572058.61635.151781.545238.08740.55
Japan163.26219.43265.47305.11330.69351.94334.11624.12682.14593.53436.1550.63
Germany39.4246.4261.8563.0957.14117.6591.63207.1172.69121.5972.16.72
United Kingdom44.8553.2978.8681.390.46105.26125.4199.13170.39202.34255.9533.7
Spain7.826.4210.8910.5312.4365.7545.365.68138.4277.4347.433.87
Netherlands15.117.6632.1944.4262.9487.09112.58249.65138.36103.75154.0314.38
China21.8522.333.2140.1851.4257.6870.43121.78125.83133.14181.2627.77
Mexico17.1217.6922.5430.9846.6356.5765.9889.6671.81105.98184.227.02
Canada30.0626.8630.6337.9738.9449.8672.2385.7667.7676.67237.849.05
Australia17.5122.7631.3133.2539.3464.7273.7978.665.9283.31102.1713.11
South Korea17.126.4239.2557.9434.8329.5135.4346.5446.6540.2938.024.48
Hong Kong10.3114.116.9522.6926.0931.3233.0138.813839.8138.568.58
Belgium20.0724.0535.3930.1331.4228.7934.0240.6836.0743.5142.951.87
France12.8814.4618.719.8823.0624.8228.6639.6931.2241.3734.172.25
Italy14.4614.4414.1118.0824.2220.4241.0141.4817.8422.4225.321.58
Taiwan6.257.858.5811.5511.0313.7617.7517.8414.6414.7212.571.81
Brazil7.776.198.3710.2112.610.1812.1116.9611.9319.4437.912.83
Russia5.215.46.739.4112.7714.8620.1810.6210.2311.9415.452.58
Sweden6.576.6910.0910.468.097.758.312.578.710.1511.210.89
Singapore4.514.535.364.855.745.484.668.438.369.4311.390.72
Denmark4.93.857.398.768.366.188.0711.997.285.426.170.55
Malaysia4.183.754.224.215.776.8911.2211.547.2510.659.81.5
See More:
  • Vietnam Electrical Wires & Telephone Cables Export Value 2011 – 2025
  • Vietnam Rice Export Value By Country 2011 – 2025
October 3, 2024 0 comment
0 FacebookTwitterLinkedinWhatsapp
OthersVietnam Export Data

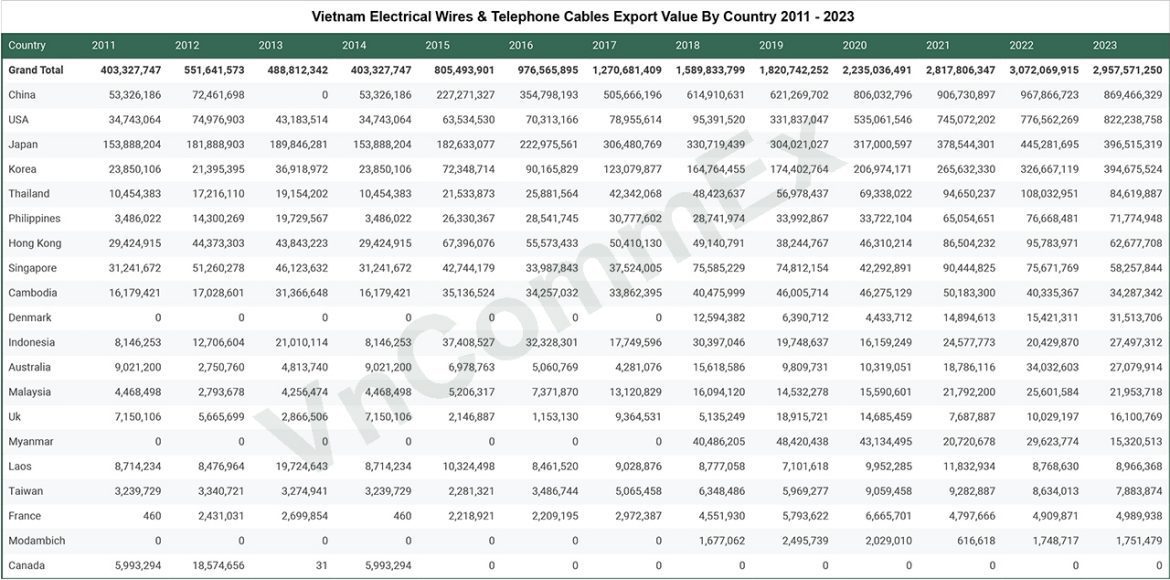
Vietnam Electrical Wires & Telephone Cables Export Value 2011 – 2025 (October updated)

by Henry Truong October 2, 2024
written by Henry Truong

Vietnam Electrical Wires & Telephone Cables Export Value 2011 – 2025 (October updated)

  • Raw data from the General Department of Vietnam Customs
  • Unit: USD Millions
Country2011201220132014201520162017201820192020202120222023202410M 2025Oct-25
Grand Total403.33551.64488.81403.33805.49976.571270.681589.831820.742235.042817.813072.072957.573101.23611.9372.8
China53.3372.46053.33227.27354.8505.67614.91621.27806.03906.73967.87869.47857.54700.4181.24
United States34.7474.9843.1834.7463.5370.3178.9695.39331.84535.06745.07776.56822.24970.511208.94121.53
Japan153.89181.89189.85153.89182.63222.98306.48330.72304.02317378.54445.28396.52332.62310.6134.65
South Korea23.8521.436.9223.8572.3590.17123.08164.76174.4206.97265.63326.67394.68441.28364.3533.58
Thailand10.4517.2219.1510.4521.5325.8842.3448.4256.9869.3494.65108.0384.6277.1171.958.24
Philippines3.4914.319.733.4926.3328.5430.7828.7433.9933.7265.0576.6771.7764.4654.55.55
Hong Kong29.4244.3743.8429.4267.455.5750.4149.1438.2446.3186.595.7862.6862.1101.210.9
Singapore31.2451.2646.1231.2442.7433.9937.5275.5974.8142.2990.4475.6758.2671.4764.787.12
Cambodia16.1817.0331.3716.1835.1434.2633.8640.4846.0146.2850.1840.3434.2947.5549.586.07
Denmark000000012.596.394.4314.8915.4231.5130.7524.310.56
Indonesia8.1512.7121.018.1537.4132.3317.7530.419.7516.1624.5820.4327.526.3230.192.23
Australia9.022.754.819.026.985.064.2815.629.8110.3218.7934.0327.0843.3246.164
Malaysia4.472.794.264.475.217.3713.1216.0914.5315.5921.7925.621.9519.8122.683.98
United Kingdom7.155.672.877.152.151.159.365.1418.9214.697.6910.0316.119.8117.771.32
Myanmar000000040.4948.4243.1320.7229.6215.3210.196.950.23
Laos8.718.4819.728.7110.328.469.038.787.19.9511.838.778.978.2415.623.03
Taiwan3.243.343.273.242.283.495.076.355.979.069.288.637.8812.2218.222.3
France02.432.702.222.212.974.555.796.674.84.914.994.475.10.35
Mozambique00000001.682.52.030.621.751.751.421.940.19
Canada5.9918.575.9900000000000
See More:
  • Vietnam Rice Export Value By Country 2011 – 2025
  • Vietnam Seafood Export Value By Country 2011 – 2025
October 2, 2024 0 comment
0 FacebookTwitterLinkedinWhatsapp
Food & Spicy IndustryVietnam Export Data

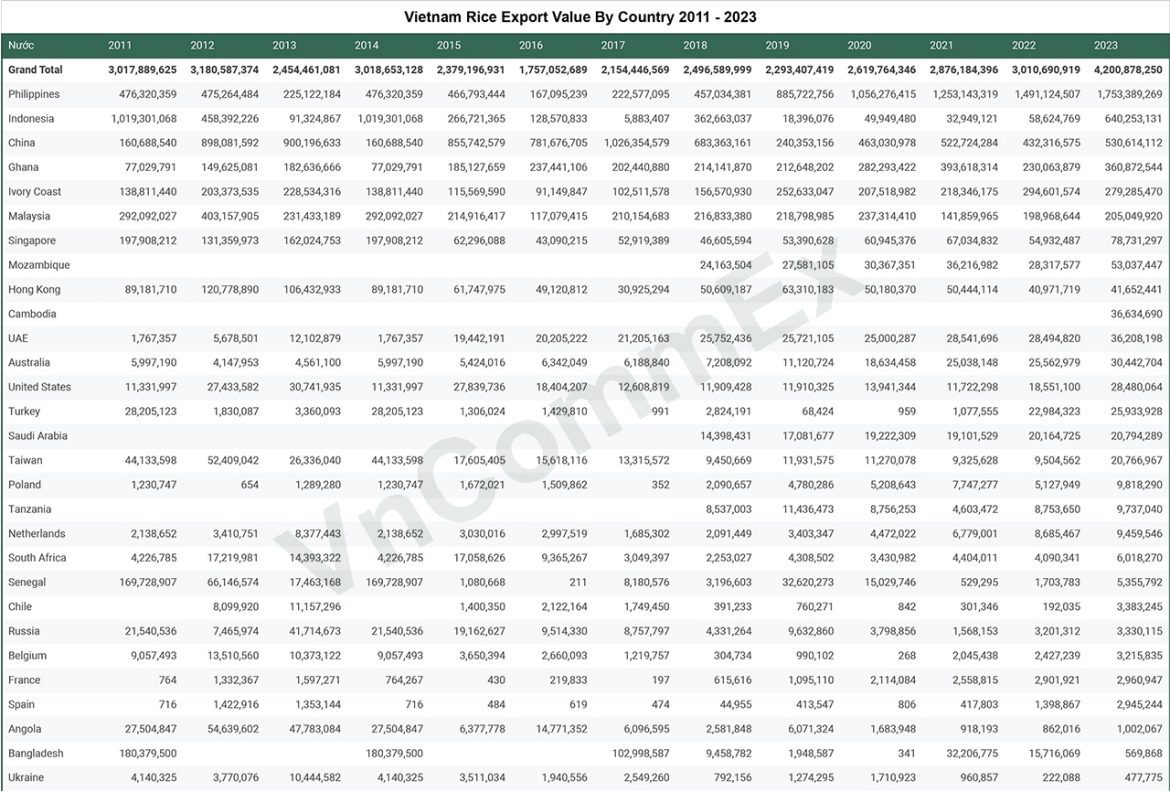
Vietnam Rice Export Value By Country 2011 – 2025 (October updated)

by Henry Truong October 1, 2024
written by Henry Truong

Vietnam Rice Export Value By Country 2011 – 2025 (October updated)

  • Raw data from the General Department of Vietnam Customs
  • Unit: USD Millions
Country2011201220132014201520162017201820192020202120222023202410M 2025Oct-25
Grand Total3017.893180.592454.463018.652379.21757.052154.452496.592293.412619.762876.183010.694200.885117.463660.7176.9
Philippines476.32475.26225.12476.32466.79167.1222.58457.03885.721056.281253.141491.121753.392610.431456.313.15
Indonesia1019.3458.3991.321019.3266.72128.575.88362.6618.449.9532.9558.62640.25746.3116.452.94
China160.69898.08900.2160.69855.74781.681026.35683.36240.35463.03522.72432.32530.61167.84319.114.55
Ghana77.03149.63182.6477.03185.13237.44202.44214.14212.65282.29393.62230.06360.87423.82468.5839.3
Ivory Coast138.81203.37228.53138.81115.5791.15102.51156.57252.63207.52218.35294.6279.29285.55421.5428.14
Malaysia292.09403.16231.43292.09214.92117.08210.15216.83218.8237.31141.86198.97205.05426.08194.7520.96
Singapore197.91131.36162.02197.9162.343.0952.9246.6153.3960.9567.0354.9378.73104.3176.846.39
Mozambique000000024.1627.5830.3736.2228.3253.0463.3550.693.18
Hong Kong89.18120.78106.4389.1861.7549.1230.9350.6163.3150.1850.4440.9741.6538.5231.562.99
Cambodia00000000000036.6337.2522.041.25
UAE1.775.6812.11.7719.4420.2121.2125.7525.722528.5428.4936.2140.1834.233.21
Australia64.154.5665.426.346.197.2111.1218.6325.0425.5630.4435.7725.062.77
United States11.3327.4330.7411.3327.8418.412.6111.9111.9113.9411.7218.5528.4830.224.581.4
Turkey28.211.833.3628.211.311.4302.820.0701.0822.9825.939.46.590.05
Saudi Arabia000000014.417.0819.2219.120.1620.7929.8620.942.51
Taiwan44.1352.4126.3444.1317.6115.6213.329.4511.9311.279.339.520.7712.399.520.61
Poland1.2301.291.231.671.5102.094.785.217.755.139.828.617.930.72
Tanzania00000008.5411.448.764.68.759.745.623.630.63
Netherlands2.143.418.382.143.0331.692.093.44.476.788.699.469.19.530.63
South Africa4.2317.2214.394.2317.069.373.052.254.313.434.44.096.026.815.120.44
Senegal169.7366.1517.46169.731.0808.183.232.6215.030.531.75.361.7751.570.59
Chile08.111.1601.42.121.750.390.7600.30.193.380.942.140.03
Russia21.547.4741.7121.5419.169.518.764.339.633.81.573.23.337.793.020
Belgium9.0613.5110.379.063.652.661.220.30.9902.052.433.220.580.090.04
France01.331.60.7600.2200.621.12.112.562.92.963.712.90.51
Spain01.421.3500000.040.4100.421.42.951.981.780.16
Angola27.554.6447.7827.56.3814.776.12.586.071.680.920.8611.490.690.07
Bangladesh180.3800180.38001039.461.95032.2115.720.570.449.960.03
Ukraine4.143.7710.444.143.511.942.550.791.271.710.960.220.487.031.430.33
Iraq14.360014.3606.7986.92168.66154.4447.61000.290.210.240.04
Brunei9.658.76.999.656.8712.766.832.513.28000.010.170.10.090.02
Algeria19.6935.6239.9319.6914.8515.1817.335.26.28000.2200.050.070
Timor-Leste11.4627.7236.7911.46000000000000
Italy0000000000000000
See More:
  • Vietnam Raw Plastic Export Value 2011 – 2025
  • Vietnam Seafood Export Value By Country 2011 – 2025
October 1, 2024 0 comment
0 FacebookTwitterLinkedinWhatsapp
SeafoodVietnam Export Data

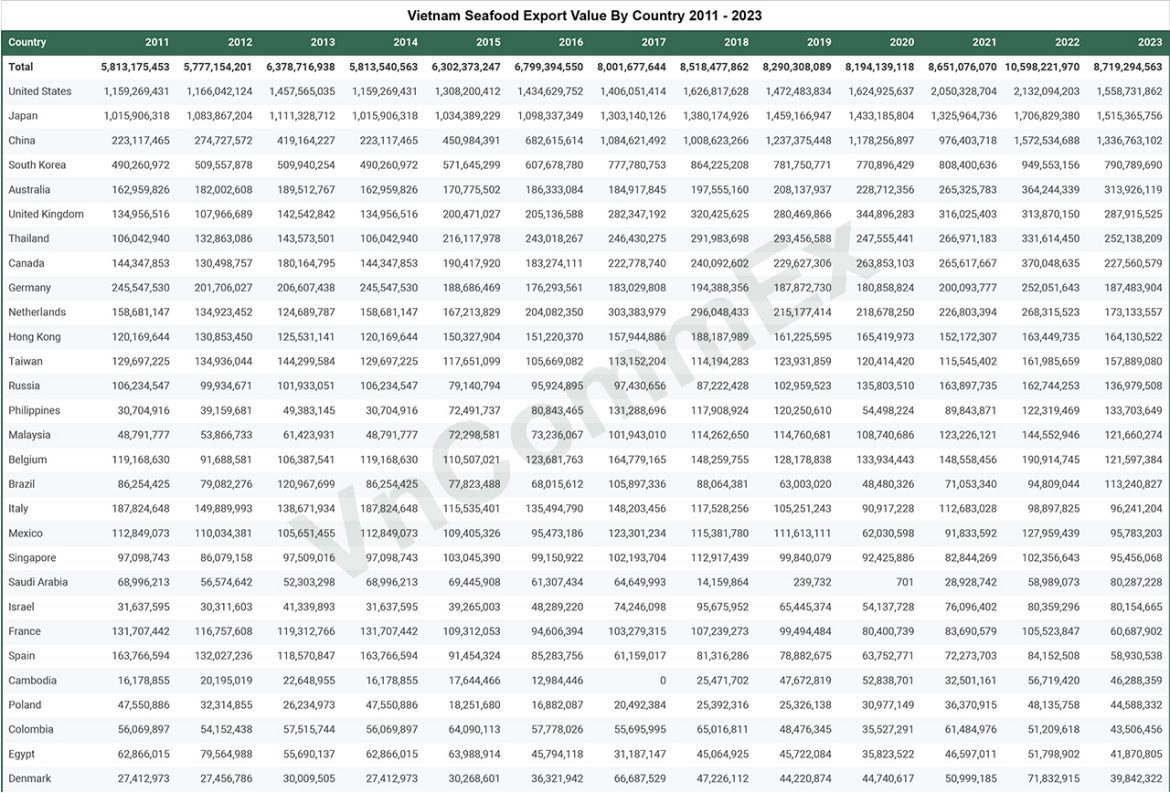
Vietnam Seafood Export Value By Country 2011 – 2025 (October updated)

by Henry Truong September 30, 2024
written by Henry Truong

Vietnam Seafood Export Value By Country 2011 – 2025 (October updated)

  • Raw data from the General Department of Vietnam Customs
  • Unit: USD Millions
Country2011201220132014201520162017201820192020202120222023202410M 2025Oct-25
Grand Total5813.185777.156378.725813.546302.376799.398001.688518.488290.318194.148651.0810598.228719.299772.959327.61159.2
United States1159.271166.041457.571159.271308.21434.631406.051626.821472.481624.932050.332132.091558.731832.851644.7226.22
Japan1015.911083.871111.331015.911034.391098.341303.141380.171459.171433.191325.961706.831515.371532.251395.28159.61
China223.12274.73419.16223.12450.98682.621084.621008.621237.381178.26976.41572.531336.761729.211881.78252
South Korea490.26509.56509.94490.26571.65607.68777.78864.23781.75770.9808.4949.55790.79806.66706.8492.3
Australia162.96182189.51162.96170.78186.33184.92197.56208.14228.71265.33364.24313.93343.14282.1737.95
United Kingdom134.96107.97142.54134.96200.47205.14282.35320.43280.47344.9316.03313.87287.92311.42274.4324.46
Thailand106.04132.86143.57106.04216.12243.02246.43291.98293.46247.56266.97331.61252.14258.59249.2429.16
Canada144.35130.5180.16144.35190.42183.27222.78240.09229.63263.85265.62370.05227.56278.38223.5725.4
Germany245.55201.71206.61245.55188.69176.29183.03194.39187.87180.86200.09252.05187.48202.35182.9920.86
Netherlands158.68134.92124.69158.68167.21204.08303.38296.05215.18218.68226.8268.32173.13198.12181.2619.2
Hong Kong120.17130.85125.53120.17150.33151.22157.94188.19161.23165.42152.17163.45164.13154.64128.0614.35
Taiwan129.7134.94144.3129.7117.65105.67113.15114.19123.93120.41115.55161.99157.89168.04160.2722.16
Russia106.2399.93101.93106.2379.1495.9297.4387.22102.96135.8163.9162.74136.98231.4180.9622.09
Philippines30.739.1649.3830.772.4980.84131.29117.91120.2554.589.84122.32133.7108.2195.4915.56
Malaysia48.7953.8761.4248.7972.373.24101.94114.26114.76108.74123.23144.55121.66112.54112.3715.93
Belgium119.1791.69106.39119.17110.51123.68164.78148.26128.18133.93148.56190.91121.6140.89139.7712.72
Brazil86.2579.08120.9786.2577.8268.02105.988.066348.4871.0594.81113.24129.13142.416.01
Italy187.82149.89138.67187.82115.54135.49148.2117.53105.2590.92112.6898.996.2492.986.944.59
Mexico112.85110.03105.65112.85109.4195.47123.3115.38111.6162.0391.83127.9695.78105.4885.039.38
Singapore97.186.0897.5197.1103.0599.15102.19112.9299.8492.4382.84102.3695.4694.8383.7411.42
Saudi Arabia6956.5752.36969.4561.3164.6514.160.24028.9358.9980.2977.0178.957.22
Israel31.6430.3141.3431.6439.2748.2974.2595.6865.4554.1476.180.3680.15102.2659.928.45
France131.71116.76119.31131.71109.3194.61103.28107.2499.4980.483.69105.5260.6952.7249.394.32
Spain163.77132.03118.57163.7791.4585.2861.1681.3278.8863.7572.2784.1558.9374.0469.638.69
Cambodia16.1820.222.6516.1817.6412.98025.4747.6752.8432.556.7246.2936.4628.12.77
Poland47.5532.3126.2347.5518.2516.8820.4925.3925.3330.9836.3748.1444.5938.0432.364.08
Colombia56.0754.1557.5256.0764.0957.7855.765.0248.4835.5361.4851.2143.5158.4247.85.72
Egypt62.8779.5655.6962.8763.9945.7931.1945.0645.7235.8246.651.841.8746.8755.277.11
Denmark27.4127.4630.0127.4130.2736.3266.6947.2344.2244.745171.8339.8450.8840.724.28
UAE45.4250.3146.4345.4253.0550.5245.0872.8257.149.8746.3458.5836.1544.0946.184.99
Lithuania00000000000034.1244.2254.917.9
Portugal42.7842.5547.8542.7844.3245.3448.1659.1149.5539.9548.3243.2332.842.2836.433.44
Switzerland60.9159.2369.4960.9135.7738.6940.7431.9321.1336.1128.573129.9229.3830.162.3
Romania14.4210.348.3114.426.457.056.727.486.668.9611.3724.524.8732.7423.582.85
Chile000000021.0515.9919.1417.6117.1422.825.1715.742.16
India12.1215.1313.9712.1219.8420.3321.052825.481015.9225.6519.8117.3117.422.37
Sweden13.5416.1912.3313.5416.9915.1915.5516.7814.5214.2418.7923.6419.1722.0828.243.24
Indonesia15.099.483.9115.092.814.845.223.875.383.566.1315.3317.4617.2615.350.61
New Zealand12.6713.6418.1612.6721.8221.1317.8120.218.7816.1716.5821.7216.6121.4416.172.35
Iraq5.888.036.415.888.7212.5110.039.5212.033.311.746.815.6630.9426.54.47
Peru00000008.418.49.147.4914.1910.938.3610.190.99
Greece20.4216.8312.220.4210.569.527.878.248.415.085.859.317.468.336.030.46
Turkey4.945.14.974.948.465.518.38.1311.086.266.348.636.593.133.490.51
Pakistan9.9513.4716.239.9522.9823.3638.0224.4113.5112.3520.5314.086.439.9911.433.01
Norway00000005.897.099.778.969.436.099.4714.532.34
Cyprus0000000000006.016.765.320.86
Kuwait9.929.79.439.9212.5710.868.288.146.516.824.285.225.14.534.880.42
Panama00000008.075.493.533.868.065.045.073.940.58
Ukraine46.4649.3941.3846.4610.4314.01018.0725.6526.7928.977.774.427.1911.541.91
Algeria00000008.56113.181.494.614.276.462.980.29
Belarus0000000000002.812.511.410.46
Senegal00000001.220.7501.342.772.351.010.790
Czech Republic10.556.554.6610.5515.4610.039.685.793.732.032.642.572.331.841.430.24
Brunei2.031.81.372.031.291.141.181.681.871.261.651.91.921.771.540.15
Angola00000001.421.2300.381.10.990.971.460.32
Sri Lanka00000008.886.963.943.371.140.540.950.820
Timor-Leste00.371.130.37000000000000
Trends and Market Fluctuations

Stable growth until 2022: Vietnam’s seafood exports saw steady growth from 2011 to 2022, peaking at a record $10.59 billion in 2022. However, export values slightly decreased in 2023.

Dominance of the U.S. and Japan markets: The U.S. and Japan continue to be the largest consumers of Vietnamese seafood, accounting for a significant share of total exports.

Industry Outlook

Vietnam’s seafood industry holds strong potential for continued growth due to:

Increasing demand for clean food: Developed countries such as the U.S., Japan, and Europe are seeing increasing demand for high-quality, food-safe seafood products.

Investment in sustainable aquaculture: Vietnam needs to continue investing in sustainable aquaculture practices to meet international standards and expand its export markets.


See More:
  • Vietnam Raw Plastic Export Value 2011 – 2025
  • Vietnam Clinker & Cement Export Value 2011 – 2025
September 30, 2024 0 comment
0 FacebookTwitterLinkedinWhatsapp
OthersVietnam Export Data

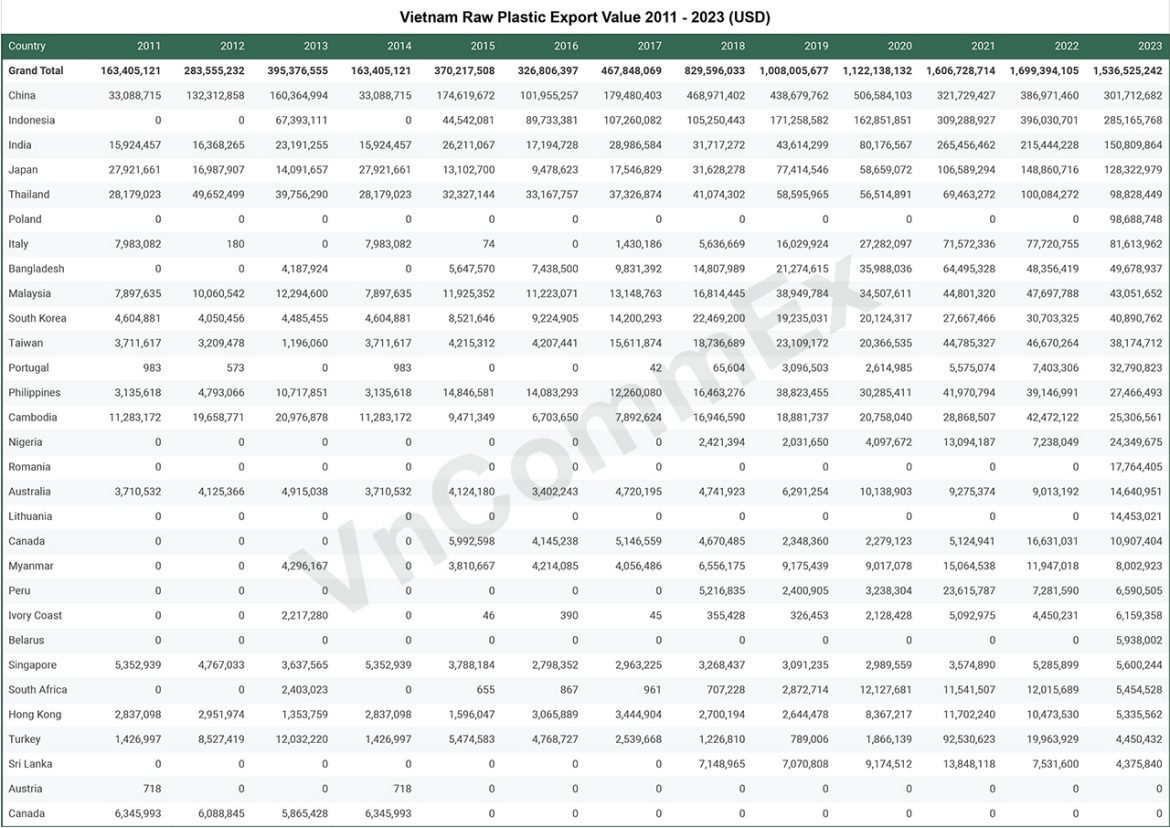
Vietnam Raw Plastic Export Value 2011 – 2025 (October updated)

by Henry Truong September 29, 2024
written by Henry Truong

Vietnam Raw Plastic Export Value 2011 – 2025 (October updated)

  • Raw data from the General Department of Vietnam Customs
  • Unit: USD Millions
Country2011201220132014201520162017201820192020202120222023202410M 2025Oct-25
Grand Total163.41283.56395.38163.41370.22326.81467.85829.61008.011122.141606.731699.391536.531893.691940.7211.4
China33.09132.31160.3633.09174.62101.96179.48468.97438.68506.58321.73386.97301.71419.11232.0141.47
Indonesia0067.39044.5489.73107.26105.25171.26162.85309.29396.03285.17390.01248.5627.19
India15.9216.3723.1915.9226.2117.1928.9931.7243.6180.18265.46215.44150.81141.06112.9611.26
Japan27.9216.9914.0927.9213.19.4817.5531.6377.4158.66106.59148.86128.32159.54176.9920.04
Thailand28.1849.6539.7628.1832.3333.1737.3341.0758.656.5169.46100.0898.83112.0961.146.39
Poland00000000000098.69112.0277.674.49
Italy7.98007.98001.435.6416.0327.2871.5777.7281.6194.12102.193.66
Bangladesh004.1905.657.449.8314.8121.2735.9964.548.3649.6857.6521.752.73
Malaysia7.910.0612.297.911.9311.2213.1516.8138.9534.5144.847.743.0553.8148.846.5
South Korea4.64.054.494.68.529.2214.222.4719.2420.1227.6730.740.8947.340.513.75
Taiwan3.713.211.23.714.224.2115.6118.7423.1120.3744.7946.6738.1750.648.435.08
Portugal00000000.073.12.615.587.432.7932.3732.291.38
Philippines3.144.7910.723.1414.8514.0812.2616.4638.8230.2941.9739.1527.4748.7355.8810.15
Cambodia11.2819.6620.9811.289.476.77.8916.9518.8820.7628.8742.4725.3134.5234.685.36
Nigeria00000002.422.034.113.097.2424.3538.818.022.53
Romania00000000000017.7614.728.440
Australia3.714.134.923.714.123.44.724.746.2910.149.289.0114.6417.4615.651.72
Lithuania00000000000014.4515.0413.220.42
Canada00005.994.155.154.672.352.285.1216.6310.919.4313.392.88
Myanmar004.303.814.214.066.569.189.0215.0611.9583.8710.872.5
Peru00000005.222.43.2423.627.286.596.571.620.26
Ivory Coast002.2200000.360.332.135.094.456.166.353.470.53
Belarus0000000000005.940.950.140.03
Singapore5.354.773.645.353.792.82.963.273.092.993.575.295.64.673.390.34
South Africa002.400000.712.8712.1311.5412.025.455.352.130.18
Hong Kong2.842.951.352.841.63.073.442.72.648.3711.710.475.348.496.680.38
Turkey1.438.5312.031.435.474.772.541.230.791.8792.5319.964.452.122.430.36
Sri Lanka00000007.157.079.1713.857.534.386.948.21.24
Austria0000000000000000
Canada6.356.095.876.350000000009.4313.392.88
Trends and Market Fluctuations

Strong growth: Vietnam’s total raw plastic export value has increased nearly tenfold from 2011 to 2023, driven by high demand from manufacturing and industrial sectors in major markets like China and Indonesia.

Development of Asian markets: Asian countries, including China, Indonesia, and India, play a dominant role in the growth of Vietnam’s raw plastic exports.

Industry Outlook

Vietnam’s raw plastic export sector holds strong potential for continued growth due to:

Rising demand: The demand for raw plastic materials in industrial production is increasing, particularly in Asia.

Investment in technology and quality: Vietnam needs to invest heavily in production technology and improve product quality to meet the stringent requirements of more demanding markets.

Market diversification: Beyond traditional markets like China and Indonesia, Vietnam should continue expanding exports to potential markets in Europe and Africa.

See More:
  • Vietnam Rubber Export Value 2011 – 2025
  • Vietnam Clinker & Cement Export Value 2011 – 2025
September 29, 2024 0 comment
0 FacebookTwitterLinkedinWhatsapp
OthersVietnam Export Data

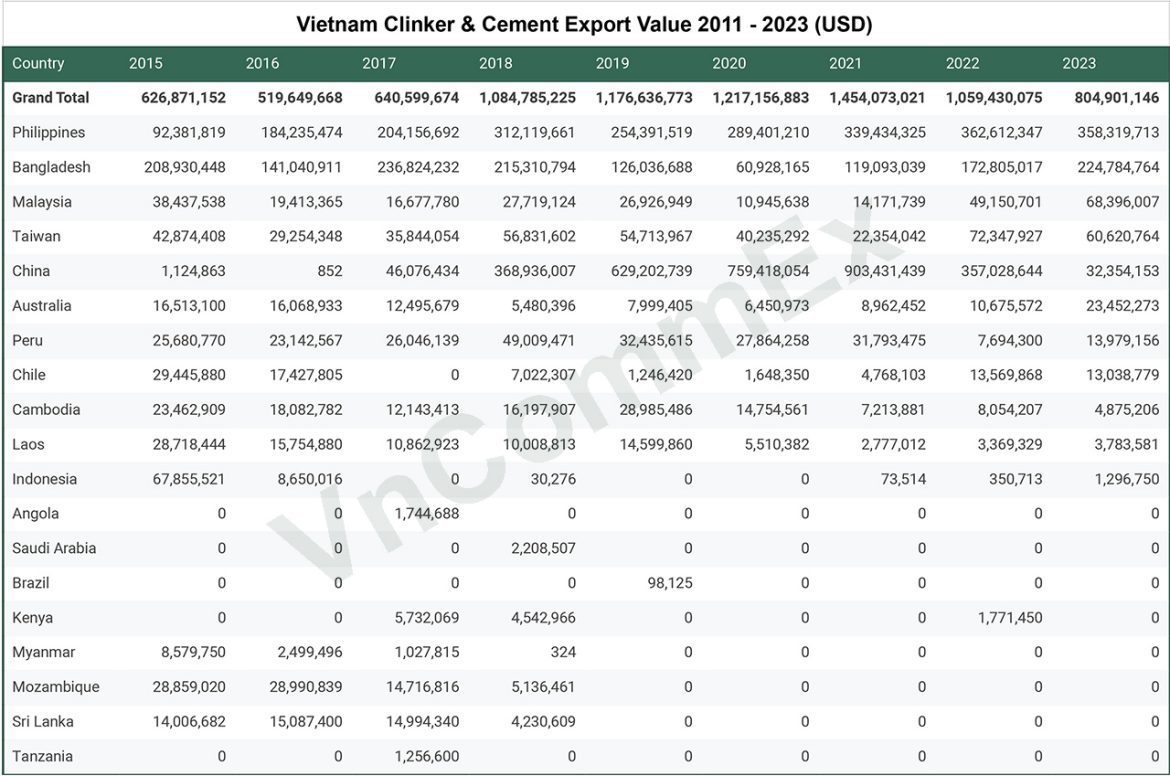
Vietnam Clinker & Cement Export Value 2015 – 2025

by Henry Truong September 28, 2024
written by Henry Truong

Vietnam Clinker & Cement Export Value 2015 – 2025 (October updated)

  • Raw data from the General Department of Vietnam Customs
  • Unit: USD Millions
Country201520162017201820192020202120222023202410M 2025Oct 2025
Grand Total626.87519.65640.61084.791176.641217.161454.071059.43804.9671.07546.0853.61
Philippines92.38184.24204.16312.12254.39289.4339.43362.61358.32319.1199.4517.01
Bangladesh208.93141.04236.82215.31126.0460.93119.09172.81224.78174.87172.8513.75
Malaysia38.4419.4116.6827.7226.9310.9514.1749.1568.45748.97.05
Taiwan42.8729.2535.8456.8354.7140.2422.3572.3560.6253.7841.665.38
China1.12046.08368.94629.2759.42903.43357.0332.351.57--
Australia16.5116.0712.55.4886.458.9610.6823.4527.2417.712.67
Peru25.6823.1426.0549.0132.4427.8631.797.6913.9817.5614.221.32
Chile29.4517.4307.021.251.654.7713.5713.0410.9412.241.38
Cambodia23.4618.0812.1416.228.9914.757.218.054.884.244.240.31
Laos28.7215.7510.8610.0114.65.512.783.373.783.2310.291.27
Indonesia67.868.6500.03000.070.351.30--
Angola001.740000001.52--
Saudi Arabia0002.2100000-12.352.04
Brazil00000.100000--
Kenya005.734.540001.770-4.72-
Myanmar8.582.51.03000000---
Mozambique28.8628.9914.725.14000000--
Sri Lanka14.0115.0914.994.230000005.19-
Tanzania001.260000000--
Trends and Market Fluctuations

Vietnam’s clinker and cement sector holds strong potential for future growth due to:

Demand from developing countries: Countries like the Philippines and Bangladesh continue to have high demand for clinker and cement from Vietnam to support large-scale construction projects.

Improved quality and environmental standards: Enhancing product quality and meeting international environmental standards will help Vietnam’s cement industry grow further and expand into new markets.

Industry Outlook

Vietnam’s raw plastic export sector holds strong potential for continued growth due to:

Rising demand: The demand for raw plastic materials in industrial production is increasing, particularly in Asia.

Investment in technology and quality: Vietnam needs to invest heavily in production technology and improve product quality to meet the stringent requirements of more demanding markets.

Market diversification: Beyond traditional markets like China and Indonesia, Vietnam should continue expanding exports to potential markets in Europe and Africa.


See More:
  • Vietnam Rubber Export Value 2011 – 2025
  • Vietnam Tea Export Value 2011 – 2025
September 28, 2024 0 comment
0 FacebookTwitterLinkedinWhatsapp
Vietnam Export Data

Vietnam Rubber Export Value 2011 – 2025 (October updated)

by Henry Truong September 27, 2024
written by Henry Truong

Vietnam Rubber Export Value 2011 – 2025 (October updated)

  • Raw data from the General Department of Vietnam Customs
  • Unit: USD Millions
Country2011201220132014201520162017201820192020202120222023202410M 2025Oct-25
Grand Total3174.712802.682426.173174.711464.881603.352153.692042.12221.32314.933209.913169.552837.733303.772588304.6
China1936.661326.431129.421936.66763.37992.691443.91371.081550.351830.222285.612384.482271.112442.051858.66238.37
India109.15211.57210.41109.15127.05116.5990.6145.39180.2889.32212.65200.21156.69211.9123.639.67
South Korea130.25112.4381.74130.254253.7979.2953.1666.7850.1288.1780.3972.5476.2565.777.11
Germany132.46103.1176.21132.4642.9948.6169.8955.2846.0735.1367.9348.5737.5460.7442.094.9
United States89.5562.7263.6689.5548.7445.2755.548.4947.7743.3171.0352.636.7851.643.73.12
Taiwan151.86123.4979.41151.8639.3640.0851.1847.343.8346.5873.4452.5336.4850.1333.32.6
Turkey53.8240.1837.1553.8227.9228.5841.1337.0739.4835.1559.8459.7831.6143.8837.23.83
Russia55.1618.6210.4455.166.9510.6511.6312.110.748.5632.8351.0631.3145.4232.341.7
Indonesia29.5724.9926.0229.5713.3215.9624.7623.8226.0120.0438.238.5325.2450.0167.468.15
Sri Lanka000000027.3418.0214.1648.9926.3116.8940.8827.432.9
Japan48.3532.6526.7548.3517.2117.0823.1919.5618.6316.0722.5218.6916.3421.7815.682.1
Netherlands9.037.9116.29.0316.716.0323.7415.6614.4112.6618.9714.0814.2414.2610.420.85
Brazil21.5919.819.1421.5915.415.7414.9913.915.5314.8621.2423.6112.5926.2517.91.59
Spain37.3527.425.8137.3515.4117.7821.8217.0213.9714.0323.381512.217.7215.170.74
Italy37.9230.3323.537.9218.7614.972618.8316.5713.6428.6520.111.5421.9319.381.51
Canada6.116.536.336.115.86.278.738.749.277.5716.4313.5210.5113.1312.870.66
Pakistan3.9310.2314.393.937.256.396.917.48.8813.1526.9117.19.8615.9915.050.88
Malaysia229.43564.14517.83229.43224.2128.86118.9876.1844.2113.089.1610.99.1256.1655.635.41
France16.1111.328.3516.115.084.866.95.866.524.578.656.255.1211.037.40.12
Mexico3.455.083.53.452.612.13.173.845.351.865.55.264.285.648.350.28
Bangladesh00000009.5813.948.1411.5510.193.265.543.680
Argentina10.9710.228.5410.974.272.683.762.832.983.465.033.742.631.771.790.12
United Kingdom9.276.135.959.272.92.582.853.473.662.714.533.72.524.493.110.13
Belgium16.6615.4311.7116.667.76.8712.685.785.086.669.745.272.487.9870.14
Peru00000003.292.652.033.463.592.44.683.240.42
Singapore0.864.93.50.860000.180.2200.50.690.680.650.250
Finland15.066.625.3715.062.221.882.262.842.352.536.392.040.581.160.410
Sweden3.614.463.193.612.12.42.672.992.771.010.640.670.450.610.490.04
Czech Republic42.831.643.22.623.680.062.262.344.730.21000.420.36
Hong Kong9.9211.276.989.922.382.023.512.982.41.962.410.30.310.060.030
Ukraine2.611.873.072.610000.060.3300.830.150000
Trends and Market Fluctuations

Fluctuations: Vietnam’s rubber export value has seen numerous fluctuations between 2011 and 2023, reflecting changes in international rubber prices and shifts in demand.

China Dominance: China accounts for more than 70% of Vietnam’s total rubber exports, indicating a heavy reliance on this single market.

Industry Outlook

Vietnam’s rubber industry holds strong potential for growth due to:

Rising global demand: The demand for natural rubber in industries like automotive manufacturing, tyre production, and medical equipment continues to grow, particularly in Asian countries.

Market diversification: Vietnam must continue to diversify its export markets, expanding beyond China to India, South Korea, and European countries.

Investment in quality: Improving the quality of rubber products and meeting international standards will help Vietnam access more competitive and high-demand markets.


  •  
See More:
  • Vietnam Confectionery and Cereal Products Export Value 2011 – 2025
  • Vietnam Tea Export Value 2011 – 2025
September 27, 2024 0 comment
0 FacebookTwitterLinkedinWhatsapp
Newer Posts
Older Posts

Recent Posts

  • Import Vietnamese Coffee: Your Strategic B2B Playbook
  • Vietnam’s Coffee Economy: Market Trends, Export, and Sustainable Future
  • Vietnamese Coffee Brands: Your Definitive Guide to Authentic Flavors, Top Picks & Smart Buying
  • Vietnamese Coffee Taste: Your Sensory Guide to Bold Flavors
  • Vietnamese Coffee: Ultimate Guide to History, Brews & Global Impact

Follow Us

Facebook Linkedin Twitter

Recent Posts

  • Import Vietnamese Coffee: Your Strategic B2B Playbook

    December 17, 2025
  • Vietnam’s Coffee Economy: Market Trends, Export, and Sustainable Future

    December 15, 2025
  • Vietnamese Coffee Brands: Your Definitive Guide to Authentic Flavors, Top Picks & Smart Buying

    December 13, 2025
  • Vietnamese Coffee Taste: Your Sensory Guide to Bold Flavors

    December 12, 2025
  • Vietnamese Coffee: Ultimate Guide to History, Brews & Global Impact

    December 11, 2025

Categories

  • Food & Spicy Industry (30)
  • Free Trade Agreement (18)
  • Fruit & Vegetable (56)
  • Garment & Footwear (11)
  • Market Insights (29)
  • Others (4)
  • Seafood (4)
  • Vietnam Commodity Market Price (17)
  • Vietnam Export Data (15)
  • Vietnam Market (6)
  • Wood & Furniture (19)

Vietnam Commodity Export offers comprehensive and in-depth information on Vietnam’s sourcing market, highlighting opportunities and challenges across various industries. We help international businesses find quality manufacturers and reliable suppliers in Vietnam, providing the critical insights needed to connect with the best partners and resources in the market.

Newsletter Subscribe
    • Homepage
    • Market Insight
    • Sourcing Service
    • Vietnam Overview
    • Publication
    • About Us
    • Contact Us
  • Product Catalogue
    • Coconut Products
    • Tropical Fruits
    • Spicy Products
    • Food & Nuts Products
    • Dried Fruit

You are looking for suppliers in Vietnam!

Shop Now
Facebook Linkedin Twitter Email
VNCOMMEX Group Co. Ltd Address: 06 Vo Van Kiet, Nguyen Thai Binh Ward, District 1, HCMC
Email: info@vncommex.com

All rights reserved. Designed and developed by Vietnam Commodity Exports

Privacy Policy

FAQ

VnCommEx
  • VCE
  • Product Catalogue
  • Market Insight
    • Wood & Furniture
    • Garment & Footwear
    • Food & Spicy Industry
    • Fruit & Vegetable
    • Others
    • Market Insights
  • Vietnam Market
    • Vietnam Commodity Market Price
    • Vietnam Export Data
    • Vietnam in FTA
  • Publication
  • About Us
  • English
    • 中文 (中国)
    • Tiếng Việt
VnCommEx
  • VCE
  • Product Catalogue
  • Market Insight
    • Wood & Furniture
    • Garment & Footwear
    • Food & Spicy Industry
    • Fruit & Vegetable
    • Others
    • Market Insights
  • Vietnam Market
    • Vietnam Commodity Market Price
    • Vietnam Export Data
    • Vietnam in FTA
  • Publication
  • About Us
  • English
    • 中文 (中国)
    • Tiếng Việt
@2021 - All Right Reserved. Designed and Developed by PenciDesign
✕

Shopping Cart

Close
No products in the cart.
Close
 
Return to shop