VnCommEx
Hợp tác xuất khẩu SUBSCRIBE
VnCommEx
Hợp tác xuất khẩu SUBSCRIBE
  • VCE
  • Product Catalogue
  • Market Insight
    • Wood & Furniture
    • Garment & Footwear
    • Food & Spicy Industry
    • Fruit & Vegetable
    • Others
    • Market Insights
  • Vietnam Market
    • Vietnam Commodity Market Price
    • Vietnam Export Data
    • Vietnam in FTA
  • Publication
  • About Us
  • English
    • 中文 (中国)
    • Tiếng Việt
VnCommEx
VnCommEx
  • VCE
  • Product Catalogue
  • Market Insight
    • Wood & Furniture
    • Garment & Footwear
    • Food & Spicy Industry
    • Fruit & Vegetable
    • Others
    • Market Insights
  • Vietnam Market
    • Vietnam Commodity Market Price
    • Vietnam Export Data
    • Vietnam in FTA
  • Publication
  • About Us
  • English
    • 中文 (中国)
    • Tiếng Việt
All Right Reserved. Designed and Developed by PenciDesign
Food & Spicy IndustryVietnam Export Data

Vietnam Tea Export Value 2011 – 2025

by Henry Truong September 26, 2024
written by Henry Truong

Vietnam Tea Export Value 2011 – 2025 (October updated)

  • Raw data from the General Department of Vietnam Customs
  • Unit: USD Millions
Country2011201220132014201520162017201820192020202120222023202410M 2025Oct-25
Grand Total136.93167.24176.89136.01190.52188.55178.04196.1214.82183.78193.54215.09170.85214.62188.6921.42
Pakistan32.545.345.8732.581.8178.5468.7181.3196.4382.5985.68102.8680.32106.7174.785.88
Taiwan26.1829.5930.926.1826.5417.7327.2828.7729.826.6828.735.9624.2225.9921.712.47
China14.8119.3118.9114.8111.6725.9814.3220.2525.1112.0614.171811.5118.8117.341.92
Russia22.1621.6119.2522.1622.3722.8424.8321.1822.3921.5219.6216.7610.58128.160.54
Iraq00000006.935.215.649.877.188.45.046.450.71
United States4.948.9711.654.949.337.57.927.127.037.029.098.387.7311.46.860.7
Indonesia11.7114.812.4811.719.2313.488.738.9710.298.156.476.727.3110.85.530.28
Saudi Arabia76.815.66753.554.35.725.494.123.954.254.275.874.570.66
Malaysia003.6702.173.072.713.043.122.943.093.73.44.284.230.51
India1.441.181.341.4402.862.070.911.435.333.63.382.894.154.170.43
UAE6.367.798.036.369.635.0510.294.212.72.62.62.652.592.341.360.24
Philippines0.921.882.2701.632.471.291.62.51.122.592.532.32.442.580.18
Kazakhstan0000000000001.531.611.320.03
Germany5.565.144.55.563.611.31.411.960.7100.620.711.261.150.90.14
Turkey001.5700000.080.011.340.120.310.970.210.320
Ukraine002.2302.591.722.112.452.422.692.151.580.870.840.570.05
Poland3.344.855.573.343.172.452.071.560.0901.080.040.610.880.520.04
Kuwait00301.77000.050.0700.10.080.060.10.040
Kyrgyzstan0000000000000.0200.020
Trends and Market Fluctuations

Inconsistent growth: Vietnam’s tea exports have fluctuated over the years, with some years showing strong growth followed by slight declines due to changes in international demand and pricing.

Dominance of Pakistan market: Pakistan accounts for a major share of total tea exports, indicating Vietnam’s heavy reliance on this market.

Industry Outlook

The tea industry in Vietnam holds potential for further development due to:

Growing demand from Asian countries: Markets such as Pakistan and Taiwan continue to maintain high demand for Vietnamese tea.

Product diversification: Developing specialized tea products, such as organic or premium teas, can help Vietnam access more upscale markets.

Investment in quality: To sustain and expand market reach, Vietnam needs to focus on improving tea quality to meet international standards.
See More:
  • Vietnam Confectionery and Cereal Products Export Value 2011 – 2025
  • Vietnam Coffee Export Value 2011 – 2025
September 26, 2024 0 comment
0 FacebookTwitterLinkedinWhatsapp
Food & Spicy IndustryVietnam Export Data

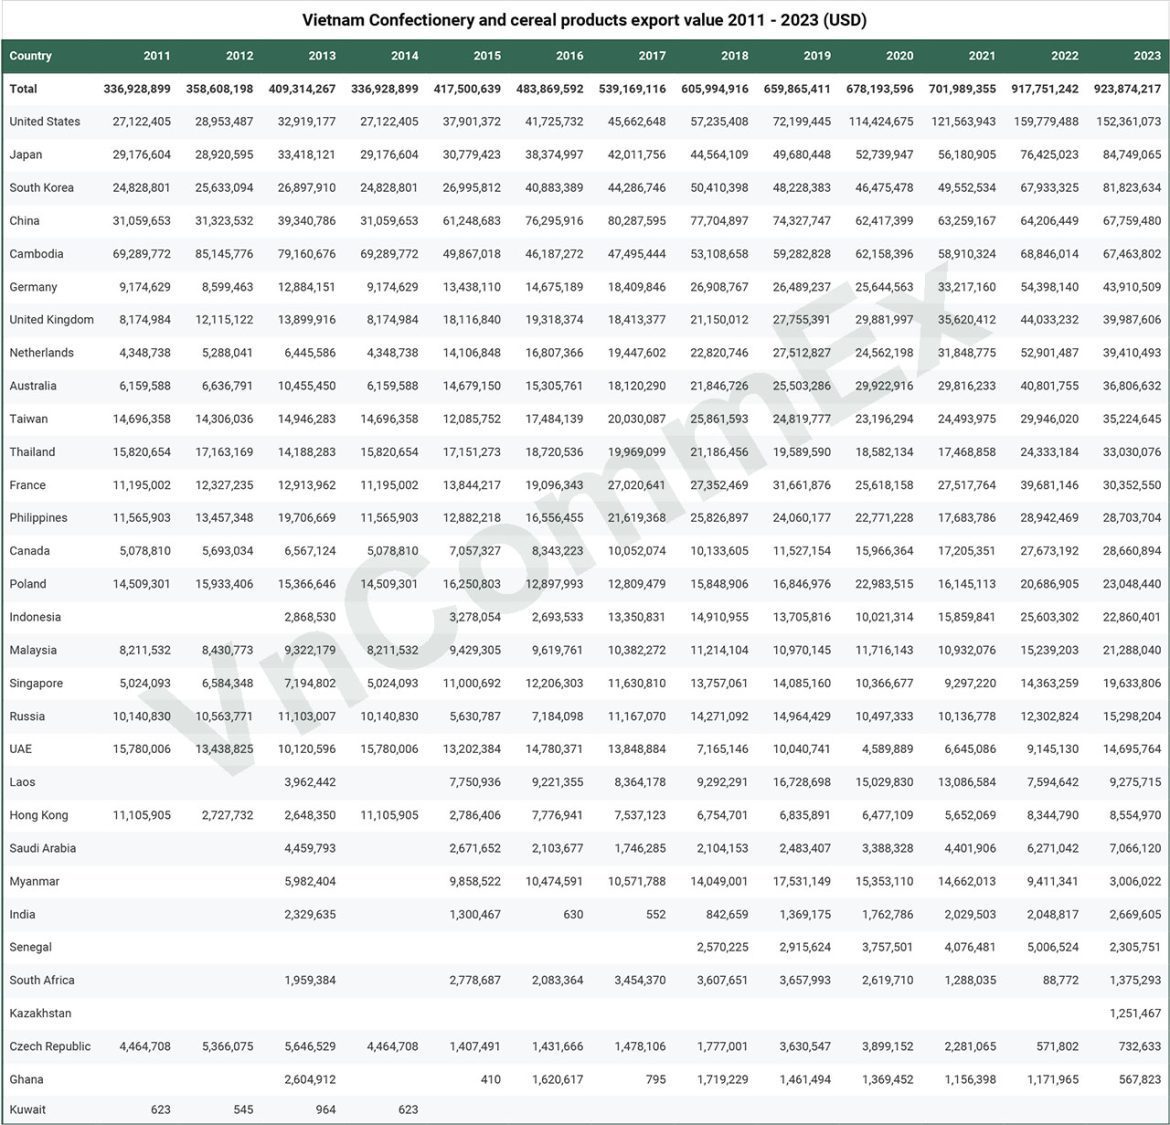
Vietnam Confectionery and Cereal Products Export Value 2011 – 2025

by Henry Truong September 25, 2024
written by Henry Truong

Vietnam Confectionery and cereal products export value 2011 – 2025 (October updated)

  • Raw data from the General Department of Vietnam Customs
  • Unit: USD Millions
Country2011201220132014201520162017201820192020202120222023202410M 2025Oct-25
Grand Total336.93358.61409.31336.93417.5483.87539.17605.99659.87678.19701.99917.75923.871113.071042.5122.1
United States27.1228.9532.9227.1237.941.7345.6657.2472.2114.42121.56159.78152.36179.34143.8516.95
Japan29.1828.9233.4229.1830.7838.3742.0144.5649.6852.7456.1876.4384.75107.48119.812.77
South Korea24.8325.6326.924.832740.8844.2950.4148.2346.4849.5567.9381.8296.0878.929.29
China31.0631.3239.3431.0661.2576.380.2977.774.3362.4263.2664.2167.7671.3957.276.1
Cambodia69.2985.1579.1669.2949.8746.1947.553.1159.2862.1658.9168.8567.4674.2375.0210.37
Germany9.178.612.889.1713.4414.6818.4126.9126.4925.6433.2254.443.9152.4341.414.61
United Kingdom8.1712.1213.98.1718.1219.3218.4121.1527.7629.8835.6244.0339.9952.2542.744.39
Netherlands4.355.296.454.3514.1116.8119.4522.8227.5124.5631.8552.939.4157.3548.235.12
Australia6.166.6410.466.1614.6815.3118.1221.8525.529.9229.8240.836.8145.5342.765.22
Taiwan14.714.3114.9514.712.0917.4820.0325.8624.8223.224.4929.9535.2242.8333.663.73
Thailand15.8217.1614.1915.8217.1518.7219.9721.1919.5918.5817.4724.3333.0333.3427.052.78
France11.212.3312.9111.213.8419.127.0227.3531.6625.6227.5239.6830.3538.1331.124.57
Philippines11.5713.4619.7111.5712.8816.5621.6225.8324.0622.7717.6828.9428.733.630.783.4
Canada5.085.696.575.087.068.3410.0510.1311.5315.9717.2127.6728.6637.2928.274.32
Poland14.5115.9315.3714.5116.2512.912.8115.8516.8522.9816.1520.6923.0538.9323.712.78
Indonesia002.8703.282.6913.3514.9113.7110.0215.8625.622.8625.1624.463.75
Malaysia8.218.439.328.219.439.6210.3811.2110.9711.7210.9315.2421.2919.1318.212.04
Singapore5.026.587.195.021112.2111.6313.7614.0910.379.314.3619.6319.8616.041.96
Russia10.1410.5611.110.145.637.1811.1714.2714.9610.510.1412.315.334.5816.852.36
UAE15.7813.4410.1215.7813.214.7813.857.1710.044.596.659.1514.716.5712.291.15
Laos003.9607.759.228.369.2916.7315.0313.097.599.288.978.191.16
Hong Kong11.112.732.6511.112.797.787.546.756.846.485.658.348.558.658.650.82
Saudi Arabia004.4602.672.11.752.12.483.394.46.277.079.466.660.81
Myanmar005.9809.8610.4710.5714.0517.5315.3514.669.413.011.441.140.06
India002.3301.3000.841.371.762.032.052.672.792.670.27
Senegal00000002.572.923.764.085.012.312.522.090.2
South Africa001.9602.782.083.453.613.662.621.290.091.381.211.350.03
Kazakhstan0000000000001.2511.60.08
Czech Republic4.465.375.654.461.411.431.481.783.633.92.280.570.730.870.720.06
Ghana002.6001.6201.721.461.371.161.170.570.640.70.31
Kuwait0000000000000000
Trends and Market Fluctuations

Steady growth: Vietnam’s confectionery and cereal exports have steadily increased year-on-year, with strong performance in key markets like the US and Japan.

Stability in traditional markets: Traditional markets such as Cambodia, South Korea, and Germany have maintained consistent import levels over the years.

Future Outlook

Vietnam’s confectionery and cereal industry is expected to continue growing due to:

Rising global demand: The demand for processed food is increasing, particularly in developed countries and emerging markets.

Improved product quality: Vietnamese businesses are investing in modern production technologies, meeting international standards for quality and food safety, thereby expanding export capabilities.

Market diversification: Vietnam is exploring potential export markets in Africa, the Middle East, and Eastern Europe to diversify its reach.

See More:
  • Vietnam Phones & Accessories Export Value 2011 – 2025
  • Vietnam Coffee Export Value 2011 – 2025
September 25, 2024 0 comment
0 FacebookTwitterLinkedinWhatsapp
Food & Spicy IndustryVietnam Export Data

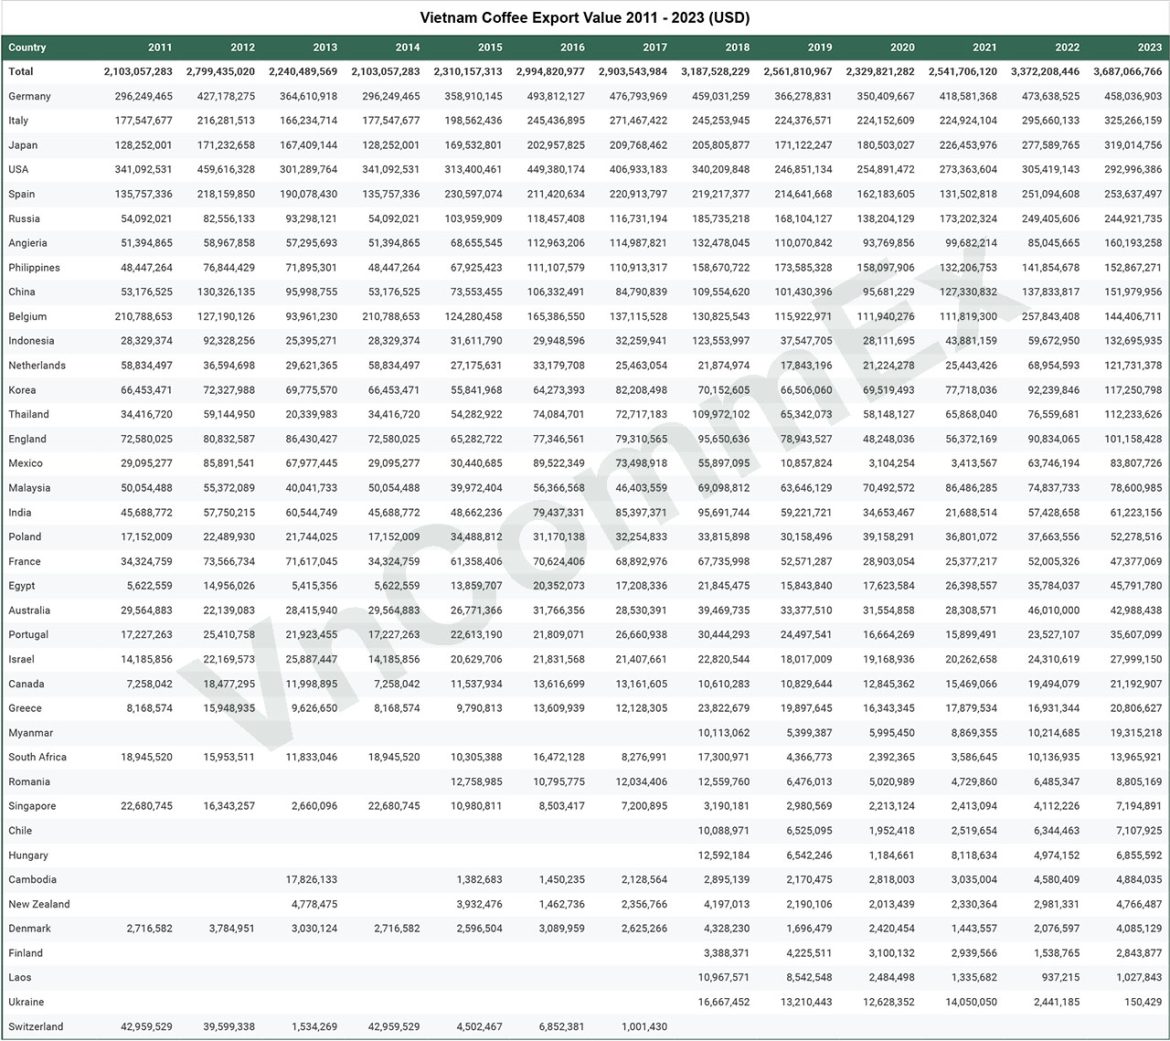
Vietnam Coffee Export Value 2011 – 2025

by Henry Truong September 24, 2024
written by Henry Truong

Vietnam Coffee Export Value 2011 – 2025 (October updated)

  • Raw data from the General Department of Vietnam Customs
  • Unit: USD Millions
Country2011201220132014201520162017201820192020202120222023202410M 2025Oct-25
Total2103.062799.442240.492906.412310.162994.822903.543187.532561.812329.822541.713372.213687.074945.217416.4394.4
Germany296.25427.18364.61502.74358.91493.81476.79459.03366.28350.41418.58473.64458.04602.89986.8146.46
United States341.09459.62301.29361.83313.4449.38406.93340.21246.85254.89273.36305.42293322.83406.9719.41
Italy177.55216.28166.23239.15198.56245.44271.47245.25224.38224.15224.92295.66325.27459.6581.8835.25
Spain135.76218.16190.08232.33230.6211.42220.91219.22214.64162.18131.5251.09253.64444.84549.1230.29
Japan128.25171.23167.41168.5169.53202.96209.77205.81171.12180.5226.45277.59319.01417.09513.1934.32
Belgium210.79127.1993.96217.54124.28165.39137.12130.83115.92111.94111.82257.84144.41157.84231.456.22
Russia54.0982.5693.3122.27103.96118.46116.73185.74168.1138.2173.2249.41244.92306.23371.3720.33
Philippines48.4576.8471.9107.267.93111.11110.91158.67173.59158.1132.21141.85152.87288.48226.718.47
China53.18130.339690.9473.55106.3384.79109.55101.4395.68127.33137.83151.98231.45197.7815.2
Algeria51.3958.9757.394.168.66112.96114.99132.48110.0793.7799.6885.05160.19127.39404.4613.14
United Kingdom72.5880.8386.4386.865.2877.3579.3195.6578.9448.2556.3790.83101.16132.65178.67.1
South Korea66.4572.3369.7869.9255.8464.2782.2170.1566.5169.5277.7292.24117.25141.98176.2310.35
Thailand34.4259.1420.3472.254.2874.0872.72109.9765.3458.1565.8776.56112.23170.34277.8526.13
India45.6957.7560.5482.7448.6679.4485.495.6959.2234.6521.6957.4361.2238.8424.772.7
Malaysia50.0555.3740.0456.2839.9756.3746.469.163.6570.4986.4974.8478.6160.56186.4812.55
France34.3273.5771.6287.2161.3670.6268.8967.7452.5728.925.3852.0147.3872.62109.587.06
Indonesia28.3392.3325.435.3531.6129.9532.26123.5537.5528.1143.8859.67132.7212.86178.7916.83
Mexico29.185.8967.9842.6130.4489.5273.555.910.863.13.4163.7583.8115.45187.942.86
Netherlands58.8336.5929.6229.5627.1833.1825.4621.8717.8421.2225.4468.95121.73236.2296.9913.86
Poland17.1522.4921.7431.8934.4931.1732.2533.8230.1639.1636.837.6652.2880.66128.167.48
Australia29.5622.1428.4229.3626.7731.7728.5339.4733.3831.5528.3146.0142.9963.6272.535.39
Portugal17.2325.4121.9227.3322.6121.8126.6630.4424.516.6615.923.5335.6150.5758.143.72
Israel14.1922.1725.8924.2920.6321.8321.4122.8218.0219.1720.2624.312837.5248.483.1
Egypt5.6214.965.429.1913.8620.3517.2121.8515.8417.6226.435.7845.7951.7754.022.04
Greece8.1715.959.6312.499.7913.6112.1323.8219.916.3417.8816.9320.8132.4434.521.32
Canada7.2618.481215.4111.5413.6213.1610.6110.8312.8515.4719.4921.1924.6846.461.94
South Africa18.9515.9511.8321.0810.3116.478.2817.34.372.393.5910.1413.974.41140.06
Singapore22.6816.342.668.2410.988.57.23.192.982.212.414.117.197.537.040.86
Romania00013.9712.7610.812.0312.566.485.024.736.498.819.2419.12.1
Myanmar000000010.115.468.8710.2119.3210.724.911.81
Ukraine000000016.6713.2112.6314.052.440.15000
Cambodia0017.831.11.381.452.132.92.172.823.044.584.887.9619.653.16
Hungary000000012.596.541.188.124.976.864.9100
Denmark2.723.783.033.342.63.092.634.331.72.421.442.084.093.947.640.48
New Zealand004.785.923.931.462.364.22.192.012.332.984.775.234.030.88
Chile000000010.096.531.952.526.347.118.126.510
Laos000000010.978.542.481.340.941.030.781.250.23
Finland00000003.394.233.12.941.542.840.961.140
Switzerland42.9639.61.533.514.56.851000000000
Trends and Market Fluctuations

Steady growth: Vietnam’s coffee exports have grown consistently over the past decade. European countries like Germany, Italy, and Spain continue to import significant amounts, while Asian markets like Japan and South Korea are showing strong growth.

Stability in traditional markets: Germany, Italy, and the USA remain Vietnam’s largest and most stable coffee importers.

Future Outlook

The outlook for Vietnam’s coffee industry remains positive due to:

Rising global demand: Coffee consumption is increasing globally, particularly in emerging markets such as China and South Korea. This trend is expanding beyond developed nations, providing opportunities for Vietnamese coffee exports.

Product quality improvement: Vietnam is transitioning from exporting raw coffee beans (green coffee) to higher-value processed coffee products. Improving product quality will help Vietnam tap into the premium coffee market segment, increasing export value.

Sustainable development: Domestic companies are increasingly focusing on sustainable coffee production. Certifications like 4C, Rainforest Alliance, and UTZ are being adopted, allowing Vietnamese coffee to meet the stringent environmental and social standards of demanding markets such as Europe.

Market diversification: In addition to traditional markets like Germany, Italy, and the USA, Vietnam is looking to expand exports to potential markets in Eastern Europe, the Middle East, and Africa.

See More:
  • Vietnam Phones & Accessories Export Value 2011 – 2025
  • Vietnam Timber Product Export Value 2011 – 2025
September 24, 2024 0 comment
0 FacebookTwitterLinkedinWhatsapp
Vietnam Export Data

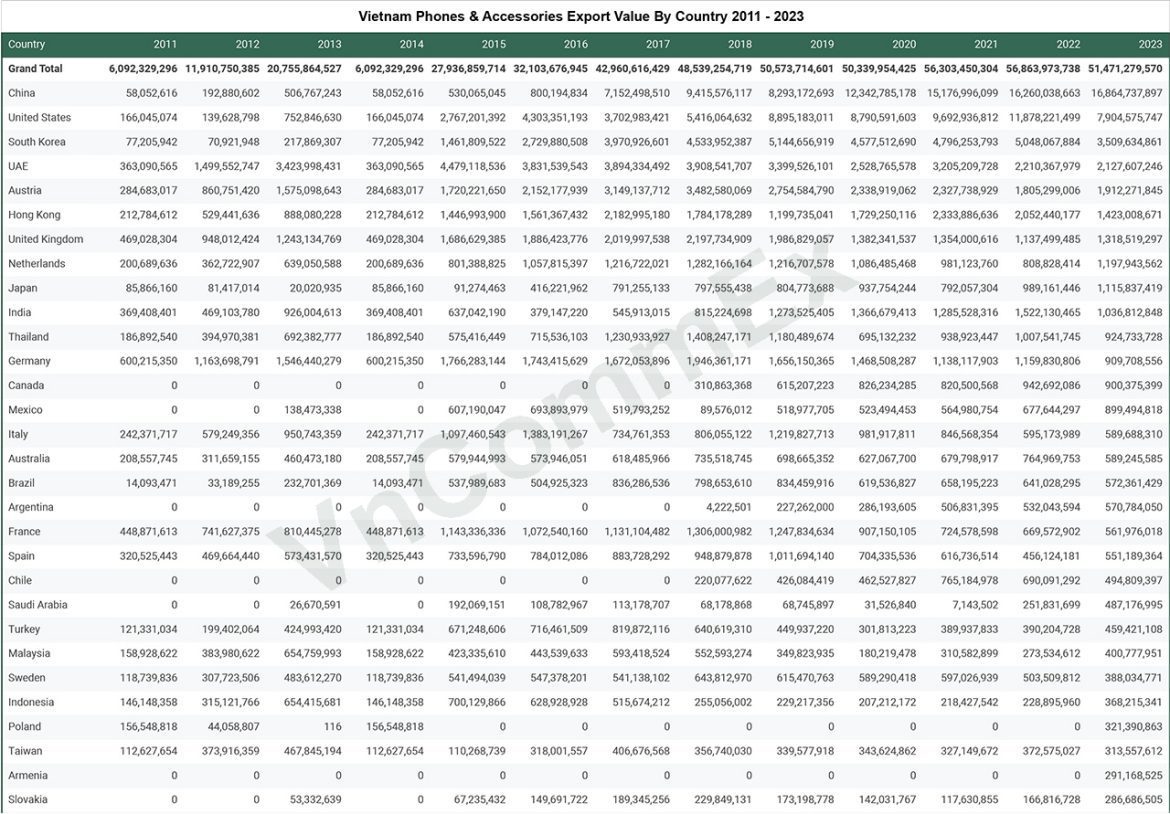
Vietnam Phones & Accessories Export Value 2011 – 2025

by Henry Truong September 23, 2024
written by Henry Truong

Vietnam Phones & Accessories Export Value 2011 – 2025 (October updated)

  • Raw data from the General Department of Vietnam Customs
  • Unit: USD Millions
Country2011201220132014201520162017201820192020202120222023202410M 2025Oct-25
Grand Total6092.3311910.7520755.866092.3327936.8632103.6842960.6248539.2550573.7150339.9556303.4556863.9751471.2852918.7348668.75082
China58.05192.88506.7758.05530.07800.197152.59415.588293.1712342.791517716260.0416864.7415439.1412091.151867.67
United States166.05139.63752.85166.052767.24303.353702.985416.068895.188790.599692.9411878.227904.589824.249015.28682.27
South Korea77.2170.92217.8777.211461.812729.883970.934533.955144.664577.514796.255048.073509.633556.323298.79289.16
UAE363.091499.553424363.094479.123831.543894.333908.543399.532528.773205.212210.372127.613172.522693.8263.11
Austria284.68860.751575.1284.681720.222152.183149.143482.582754.582338.922327.741805.31912.271417.111633.6171.23
Hong Kong212.78529.44888.08212.781446.991561.3721831784.181199.741729.252333.892052.441423.011244.731117.1356.17
United Kingdom469.03948.011243.13469.031686.631886.4220202197.731986.831382.3413541137.51318.521101.611219.51122.71
Netherlands200.69362.72639.05200.69801.391057.821216.721282.171216.711086.49981.12808.831197.941058.23929.584.3
Japan85.8781.4220.0285.8791.27416.22791.26797.56804.77937.75792.06989.161115.841377.631376.3294.86
India369.41469.1926369.41637.04379.15545.91815.221273.531366.681285.531522.131036.811685.611898.01167.73
Thailand186.89394.97692.38186.89575.42715.541230.931408.251180.49695.13938.921007.54924.73785.44675.9754.33
Germany600.221163.71546.44600.221766.281743.421672.051946.361656.151468.511138.121159.83909.71830.94684.660.78
Canada0000000310.86615.21826.23820.5942.69900.38601.08650.2577.49
Mexico00138.470607.19693.89519.7989.58518.98523.49564.98677.64899.491103.821021.32106.47
Italy242.37579.25950.74242.371097.461383.19734.76806.061219.83981.92846.57595.17589.69486.1651363.87
Australia208.56311.66460.47208.56579.94573.95618.49735.52698.67627.07679.8764.97589.25643.42598.4135.86
Brazil14.0933.19232.714.09537.99504.93836.29798.65834.46619.54658.2641.03572.36619.89444.8745.11
Argentina00000004.22227.26286.19506.83532.04570.78205.6366.730.08
France448.87741.63810.45448.871143.341072.541131.113061247.83907.15724.58669.57561.98514.67535.9953.74
Spain320.53469.66573.43320.53733.6784.01883.73948.881011.69704.34616.74456.12551.19492.95413.4232.22
Chile0000000220.08426.08462.53765.18690.09494.81429.7352.452.96
Saudi Arabia0026.670192.07108.78113.1868.1868.7531.537.14251.83487.18803.6822.5384.49
Turkey121.33199.4424.99121.33671.25716.46819.87640.62449.94301.81389.94390.2459.42474.18442.5851.9
Malaysia158.93383.98654.76158.93423.34443.54593.42552.59349.82180.22310.58273.53400.78392.23332.2433.34
Sweden118.74307.72483.61118.74541.49547.38541.14643.81615.47589.29597.03503.51388.03327.9319.3331.5
Indonesia146.15315.12654.42146.15700.13628.93515.67255.06229.22207.21218.43228.9368.22387.59289.2118.83
Poland156.5544.060156.5500000000321.39318.97218.5818.84
Taiwan112.63373.92467.85112.63110.27318406.68356.74339.58343.62327.15372.58313.56373.34315.724.79
Armenia000000000000291.17424.92412.3757.59
Slovakia0053.33067.24149.69189.35229.85173.2142.03117.63166.82286.69471.43470.1834.26
Kazakhstan000000000000253.89265.25275.7429.97
Singapore101.99224.4327.57101.99297.08258.51322.11292.33224.32207.86260.35279.82243.29276.53325.320.5
South Africa106.78231.13461.85106.78575.09465.25356.12277.1364.54287.13379.83318.4219.32200.61259.5536.73
Colombia0030.210139.16147.98280.8135.14251.06239.67339.65326.52199.83207.56185.3819.9
New Zealand0093.080110.47119.29168.39181.76187.83147.96225.39209.21191.56180.12147.1312.73
Israel00214.250270.29278393.48420.87424.21315.23355.69293.21186.91237.08202.8218.98
Peru000000039.37138.8118.95282.58219.43154.82173156.7218.1
Philippines121.43143.7150.28121.43137.41214.25428.58385.38289.63142.26235.95206.77153.18212.34226.319.48
Portugal00104.490148.12150.75156.74186.78190.26168.22194.56174.11148.39101.3589.268.02
Greece0092.77061.4871.1982.95111.18116.33116.98150.61145.46143.1892.9100.798.15
Panama000000037.95100.4693.9299.37118.44118.4714012212.06
Pakistan000000064.3733.0736.6480.71193.168.12127.861298.86
Egypt000000026.2423.7519.420.2627.960.2353.569.926.81
Bangladesh000000026.12100.04122.53153.1107.9912.8110.6718.795.57
Nigeria000000011.5312.0510.1513.918.239.075.571.990.12
Russia536.09770.65785.6536.09640.28715.981093.391103.251017.291090.81059.38154.037.657.68--
Sri Lanka00000003458.8240.0983.916.582.353.274.270.55
Romania00000007.256.314.284.493.172.120.38--
Hungary00000005.095.77.874.131.881.3656.8896.438.09
Czech Republic00000007.675.94.765.86.041.250.3111.792.36
Kenya00000002.231.711.671.281.060.720.83-0.04
Ukraine0091.93084.499.89146.16139.84124.41137.65168.2122.550.60.04--
Cambodia38.742.2413.6138.703.3536.6218.660.2402.463.290.30.040.520.19
Kuwait000000016.044.742.421.110.540.150--
Algeria0026.630104.3376.8762.0708.2900000--
Iraq000000017.723.8800000--
Myanmar000000036.4948.7744.646.680.100--
Switzerland64.6325.94064.630000000000--
Trends and Market Fluctuations

Strong Growth: From 2011 to 2019, Vietnam’s phone exports saw steady growth, though since 2020, there’s been a slowdown, particularly in major markets like the U.S. and China.

Country-Specific Fluctuations: While China and the U.S. experienced significant growth, there were notable fluctuations. In contrast, South Korea and other markets showed more stability.

Factors Influencing Exports

COVID-19 Pandemic: The global COVID-19 pandemic severely disrupted supply chains, particularly affecting electronics exports from 2020 onwards.

Trade Tensions: Trade tensions between the U.S. and China have also placed pressure on Vietnam’s export markets.

Future Outlook

As supply chains shift to Southeast Asia and high-tech manufacturing is encouraged, Vietnam remains one of the world’s largest electronics exporters. However, keeping an eye on international market fluctuations is crucial for sustained growth.

Conclusion

Phone and electronic component exports continue to play a pivotal role in Vietnam’s economy. With strong growth in key markets such as China and the United States, along with long-term development prospects, Vietnam is shaping up to be one of the leading technology and electronics manufacturing hubs in the region.

See More:
  • Vietnam Footwear Export Value 2011 – 2025
  • Vietnam Textile And Garment Export Value 2011 – 2025
September 23, 2024 0 comment
0 FacebookTwitterLinkedinWhatsapp
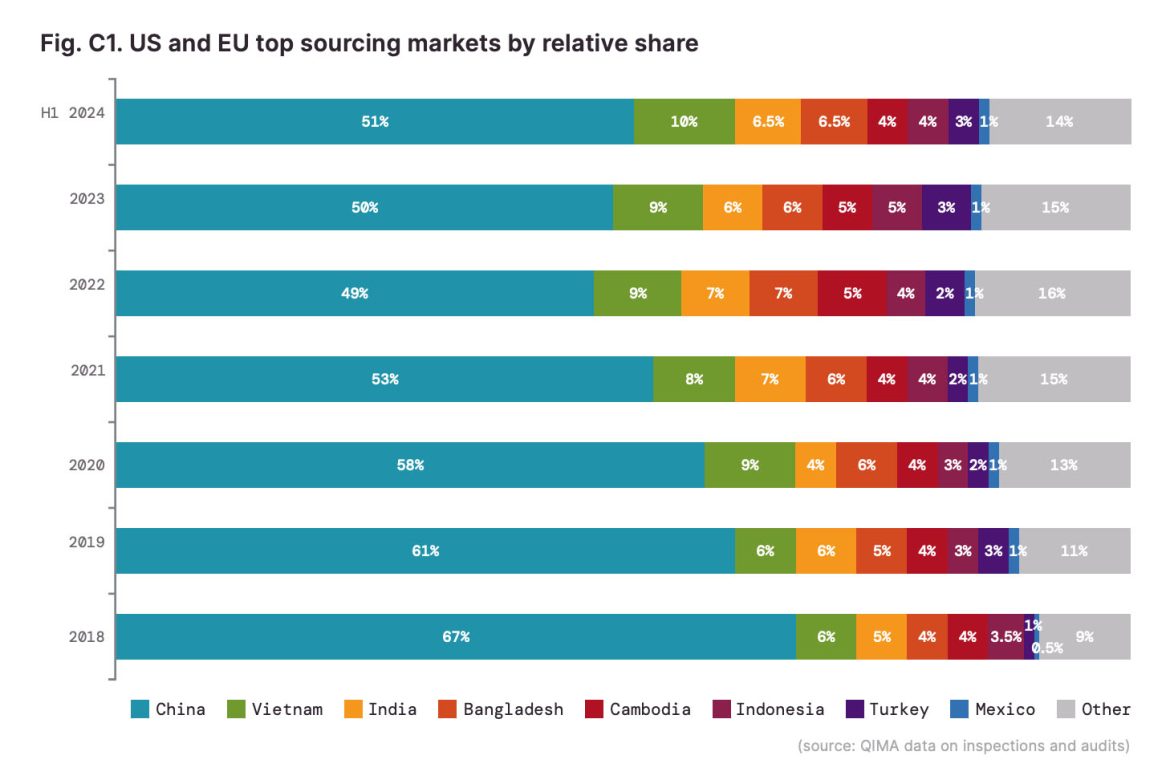
global sourcing
Market Insights

Sourcing from China, Vietnam, India, and Bangladesh: Pros and Cons

by Henry Truong September 18, 2024
written by Henry Truong

What are the pros and cons of sourcing products from China?

Sourcing products from China offers both significant advantages and notable disadvantages for global businesses. China has long been a dominant force in global production, but understanding its current landscape, including its strengths in manufacturing and infrastructure, alongside challenges like rising costs and trade tensions, is crucial for informed sourcing decisions.

Advantages of Sourcing from China

1. Productivity of the workforce

While the average salary of workers in China is around $1,200 to $1,500 per month (higher than in countries like Vietnam or Bangladesh), China’s labour productivity is significantly higher due to its skilled workforce and advanced technology integration. For example, in the electronics sector, China’s labour productivity is about 1.8 times higher than that of Vietnam, allowing for faster production cycles and reduced overall costs.

China’s large-scale manufacturing capabilities enable it to achieve significant economies of scale. For instance, the Pearl River Delta region, which includes cities like Shenzhen and Guangzhou, is home to thousands of factories that produce components for consumer electronics. This dense network of suppliers and manufacturers allows companies to source components at a much lower cost due to high-volume production.

2. Developed Infrastructure

China’s logistics network is highly advanced, with over 40 major seaports, including Shanghai, the world’s busiest container port handling over 43 million TEUs (Twenty-Foot Equivalent Units) annually. High-speed railways and extensive road networks connect major manufacturing hubs to ports, ensuring quick and efficient transportation of goods. The ability to ship goods from manufacturing centres to major ports within 1-3 days reduces lead times and shipping costs.

Ports like Shenzhen and Guangzhou offer lower handling and storage costs due to their high throughput and efficiency. The shipping cost from these ports to major destinations like Los Angeles or Rotterdam ranges between $1,500 to $2,500 per 40-foot container (FOB) as of 2023, making it cost-effective compared to other Asian countries.

4. Wide Range of Supplier Options

China boasts a well-developed supplier ecosystem across industries like electronics, textiles, and machinery. Cities such as Shenzhen and Suzhou specialize in electronics and textiles, offering flexibility for businesses. Chinese suppliers are known for reliability and scalability, handling both small and large orders, making them ideal for startups and multinationals. In addition to low-cost production, China leads in advanced manufacturing, investing in Industry 4.0 technologies like automation and AI. For example, Foxconn uses automation to boost efficiency and lower labour costs in its assembly lines.

5. Benefits from Numerous Bilateral and Multilateral Free Trade Agreements (FTAs)

China has 19 active Free Trade Agreements (FTAs) that offer tariff reductions and preferential market access. The Regional Comprehensive Economic Partnership (RCEP), covering 15 Asia-Pacific countries and 30% of global GDP, allows Chinese products to enter key markets with reduced tariffs, boosting competitiveness. In industries like textiles, electronics, and automotive, these reduced tariffs lower the overall cost of imports. For example, the China-ASEAN Free Trade Agreement (CAFTA) enables tariff-free trade between China and ASEAN countries, cutting sourcing costs for materials and components.

sourcing from china

Disadvantages of Sourcing from China

Sourcing from China also presents several challenges, particularly due to trade tensions, supply chain strategies, and evolving manufacturer policies. Below is a detailed breakdown of the disadvantages:

Trade Tensions

Since 2018, trade tensions between the U.S. and China have escalated, with the U.S. imposing significant tariffs on Chinese imports—up to 25% in some cases. These tariffs impact a wide range of products, including electronics, home appliances, and various industrial goods. Importers must account for these additional costs when sourcing from China to avoid unexpected expenses or compliance issues at the final stages of importation.

Under Section 301 of the U.S. Trade Act, the U.S. has levied tariffs on approximately $360 billion worth of Chinese goods. Similarly, the European Union (EU) and other countries have imposed their own restrictions and increased scrutiny on Chinese imports, affecting the flow of goods and increasing the complexity of international trade compliance.

Manufacturers’ Strategy When Sourcing from China

Supply Chain Diversification Strategy

In response to geopolitical risks and increasing tariffs, many global companies like Apple, Samsung, and major retailers have adopted a “China +1” or “China +2” strategy. This approach involves maintaining some production in China while simultaneously expanding manufacturing or sourcing to other countries like Vietnam, India, and Indonesia. The aim is to diversify supply chains and reduce dependence on a single country, thereby minimizing risks related to trade tensions and other geopolitical uncertainties.

Renegotiating Contracts and Finding Local Suppliers

To mitigate rising costs and comply with international labour and environmental standards, businesses are increasingly renegotiating contracts with Chinese suppliers. Companies are also exploring partnerships with local suppliers in other countries to ensure more stable and sustainable sourcing options, which could lead to better pricing, reduced risks, and compliance with global standards.
Using Technology to Enhance Quality Control
To improve transparency and ensure the quality of goods from Chinese suppliers, many companies are turning to advanced supply chain monitoring and management technologies. Tools like blockchain and the Internet of Things (IoT) are being utilized to track goods in real-time, validate supplier compliance, and maintain high-quality standards throughout the supply chain.

Why should I consider sourcing from Vietnam, and what are the challenges?

Vietnam is rapidly emerging as a key sourcing destination in Asia, particularly for businesses adopting a “China+1” strategy. Its extensive network of 16 free trade agreements (FTAs) makes it highly attractive for global importers. However, while Vietnam offers numerous benefits, businesses must also be aware of potential challenges and disadvantages when considering it as a sourcing hub.

Advantages of sourcing from Vietnam

1. Favourable Geography and Long Coastline

Vietnam’s 3,260 km coastline is home to major seaports like Hai Phong, Da Nang, Cat Lai, and Cai Mep – Thi Vai, facilitating efficient transport of goods from inland production centres. Key industrial hubs such as Hanoi, Bac Ninh, Da Nang, HCMC, Binh Duong, and Dong Nai are within 50-150 km of these ports, reducing domestic transport time and costs. This well-developed seaport infrastructure and proximity to production centres lower maritime transport and import-export costs, benefiting businesses by saving on international shipping expenses.

2. Rich Climate and Soil Conditions

Vietnam has a tropical monsoon climate that varies from north to south, making it suitable for cultivating a wide range of crops such as rice, coffee, tea, pepper, cashew, rubber, and tropical fruits (e.g., mango, dragon fruit, passion fruit, longan, lychee).

The Red River Delta (North) and the Mekong River Delta (South) are vital agricultural centres, serving as the country’s major rice granaries. The Mekong River Delta, in particular, is a hub for fruit and seafood production, catering to both domestic and export markets.

Vietnam’s rich river system, including the Mekong, Red, and Dong Nai rivers, provides essential water resources for agricultural production and aquaculture, supporting a robust and diverse agricultural base.

4. Manufacturing Capabilities and Flexible Supply Chain

Vietnam boasts diverse manufacturing capabilities across various industries, such as textiles, footwear, electronics, and furniture. The country’s strategic location, well-developed infrastructure, and proximity to international ports and airports enable efficient production and rapid export, meeting the fast-paced demands of global markets. With competitive labour costs and a skilled workforce, Vietnam has become a key destination for both traditional industries, like textiles and handicrafts, and high-tech sectors, such as electronics assembly. This adaptability across sectors strengthens its position in the global supply chain, making it an attractive choice for international businesses.

5. Benefits from Free Trade Agreements (FTAs)

Vietnam is a participant in several key FTAs, including the CPTPP (Comprehensive and Progressive Agreement for Trans-Pacific Partnership), EVFTA (Vietnam-EU Free Trade Agreement), RCEP (Regional Comprehensive Economic Partnership), and agreements with Japan, Korea, and ASEAN, among others.
These FTAs provide Vietnam with preferential tariffs or tax exemptions when exporting to significant markets like the EU, Japan, and Korea, enhancing the competitiveness of Vietnamese products and attracting foreign investment.

The FTAs not only facilitate easier export of Vietnamese goods but also broaden the network of trade partners, allowing businesses in Vietnam to diversify export markets and reduce dependency on traditional markets.

6. Young, Abundant, and Highly Skilled Labor Force

Vietnam’s rise as a global sourcing hub is supported by its young, skilled labour force and stable political environment, key factors for international investors. With 55% of the population under 35, Vietnam offers an abundant, cost-efficient labour supply, with wages ranging from $300 to $400 per month—much lower than in countries like China. The workforce is highly skilled in labour-intensive industries such as textiles, footwear, electronics, and handicrafts, making Vietnam an attractive destination for companies like Nike, Adidas, and Samsung, which benefit from the country’s craftsmanship and attention to detail.

7. Stable Political Situation and Clear Development Orientation

Vietnam’s political stability, led by the Communist Party, provides a reliable environment for long-term business planning, free from major internal conflicts or unrest. The absence of political crises or armed conflicts in the region further reduces risks for businesses. Vietnam also adopts a peaceful, multilateral foreign policy, strengthening ties with international organizations like the UN, ASEAN, WTO, CPTPP, and RCEP. These memberships boost global trade and attract foreign investment. Combined with its young, skilled labour force and cost-efficient production, Vietnam is an ideal destination for companies seeking diversification beyond China.

sourcing from vietnam

Disadvantages of Sourcing from Vietnam

While Vietnam presents several advantages as a sourcing destination, there are also notable challenges that businesses must consider. Here is a detailed analysis of the disadvantages:

1. Incomplete Infrastructure

Despite ongoing infrastructure investments, Vietnam’s logistics system faces challenges. Traffic congestion in major cities like Hanoi and Ho Chi Minh City disrupts efficient goods movement. Some port infrastructure needs upgrades to handle larger cargo volumes and vessels. Additionally, limited domestic freight capacity affects smooth transportation from production centres to ports, potentially leading to delays and higher logistics costs.

2. Uneven Product Quality

Businesses sourcing products from Vietnam, especially in the textile and agricultural sectors, may encounter issues with uneven product quality. This inconsistency can arise from variations in local suppliers’ manufacturing standards, lack of advanced quality control processes, or differences in raw material quality. To mitigate these risks, companies need to implement strict monitoring and quality assurance processes and develop strong, trustworthy relationships with local suppliers to ensure consistent product quality.

3. Limited Production Capacity Compared to China

Vietnam’s production scale and capacity are more limited compared to China, which is known for its vast manufacturing capabilities and ability to handle large orders and complex production requirements. While Vietnam has a growing industrial base, it may struggle to meet exceptionally large orders or highly specialized manufacturing needs from international companies, particularly in sectors like electronics, heavy machinery, or automotive parts. This limitation may necessitate a dual-sourcing strategy to balance volume and quality.

What are the advantages and disadvantages of sourcing products from India?

Advantages of What are the advantages and disadvantages of sourcing products from India?

India is an emerging powerhouse in global sourcing, offering a range of advantages that make it an attractive destination for businesses looking to diversify their supply chains. Below is a detailed analysis of the key benefits of sourcing from India

1. Low Production Costs

India’s labour costs are highly competitive, with average wages ranging from $150 to $250 per month, far lower than in China ($1,200 – $1,500) and Vietnam ($300 – $400). This makes India an attractive destination for labour-intensive industries like textiles, footwear, and agriculture. The country also benefits from a vast pool of low-cost, unskilled labour, helping reduce production costs in sectors such as garment manufacturing and agriculture. Additionally, India is known for its skilled workforce in IT, software development, and business process outsourcing (BPO), offering lower costs for professionals compared to developed nations, making it a global leader in outsourcing services.

2. Diverse and Flexible Manufacturing Capabilities

India boasts a wide range of manufacturing strengths across multiple sectors, including textiles, footwear, pharmaceuticals, chemicals, heavy industries, and agriculture. Its ability to produce a diverse array of products, from garments to industrial goods, makes it a highly competitive and flexible sourcing destination. With cost-effective production and adherence to global quality standards, India caters to various international markets. The country’s robust infrastructure and versatile industries allow it to meet global demand efficiently, ensuring a reliable supply chain across multiple sectors.

3. Benefits of Free Trade Agreements (FTAs)

India has signed numerous bilateral and multilateral FTAs, such as the India-Japan Comprehensive Economic Partnership Agreement (CEPA), the ASEAN-India Free Trade Agreement (AIFTA), and the Comprehensive Economic Partnership Agreement with Korea (CEPA). These agreements offer Indian goods easier access to major markets like Japan, Korea, and ASEAN countries, reducing both tariff and non-tariff barriers. This increases the competitiveness of Indian products and encourages foreign companies to source from India.

4. Investment Support and Incentives from the Government

The Indian government launched the “Make in India” initiative to attract foreign investment and boost domestic manufacturing. This initiative offers several benefits, including tax incentives, infrastructure support, and an improved business environment, making it easier for international companies to invest and manufacture in India. The initiative also focuses on upgrading the skills of Indian workers through various training and development programs, creating a skilled, industry-ready workforce. This proactive government support makes India an attractive destination for both manufacturing and sourcing.

sourcing from india

Disadvantages of What are the advantages and disadvantages of sourcing products from India?

While India offers numerous advantages as a sourcing destination, there are also several challenges that businesses must carefully consider. Below is a detailed analysis of the disadvantages:

1. Incomplete Infrastructure

Despite recent infrastructure investments, India’s road, seaport, and logistics networks remain underdeveloped compared to countries like China. Poorly maintained roads, under-capacity seaports, and limited connectivity between production hubs and ports create challenges. Transporting goods is often costly due to uneven infrastructure and traffic congestion in major cities like Mumbai and Delhi, increasing time and expenses, and impacting overall supply chain efficiency.

2. Complex Bureaucracy and Legal Procedures

India’s customs procedures are often complex and time-consuming, with overlapping administrative processes, extensive paperwork, and multiple approvals, causing delays in imports and exports. Additionally, frequent changes in tax and trade policies, including tariffs and regulations, make long-term business planning difficult. These sudden shifts can disrupt operations, increase costs, and force companies to constantly adapt their sourcing strategies.

3. Compliance and Labor Standards Risks

Some suppliers in India do not fully comply with international labour and environmental standards. Issues such as poor working conditions, low wages, child labour, and environmental pollution can pose significant risks to the reputation and compliance standards of international companies sourcing from India. Ensuring supplier compliance with global standards often requires businesses to invest in stricter monitoring, audits, and quality control measures to mitigate these risks.

What are the benefits and drawbacks of sourcing from Bangladesh?

Bangladesh has established itself as a prominent sourcing destination in Asia, primarily driven by its exceptionally low production costs, a large and experienced labor force, and significant growth in key sectors like textiles and garments. While these factors offer substantial benefits for international businesses, it’s also important to understand the potential drawbacks when considering Bangladesh for sourcing.

1. Low Production Costs

Bangladesh offers some of the lowest labour costs in Asia, with wages for unskilled labour ranging from $100 to $150 per month, much lower than China ($1,200 – $1,500) and Vietnam ($300 – $400). This makes Bangladesh highly cost-effective, particularly for labour-intensive industries like textiles and garments, where the minimum wage is around $95 per month.

Additionally, lower costs for electricity, water, and transportation further reduce operating expenses, making Bangladesh an attractive option for companies aiming to minimize production costs.

2. Large Manufacturing Capacity in the Textile and Garment Industry

Bangladesh is the world’s second-largest apparel exporter, after China, supplying major fashion brands like H&M, Zara, Primark, Uniqlo, and Walmart. The textile and garment industry makes up about 80% of the country’s exports. With a comprehensive supply chain, from fabric production to packaging and shipping, Bangladesh simplifies sourcing for international companies. Its factories offer large production capacities and meet international quality and safety standards, making it a reliable, cost-effective partner for global brands focused on quality and compliance.

3. Advantages of Trade Agreements and Tariff Preferences

Bangladesh benefits from the Generalized System of Preferences (GSP) with countries like the EU, Canada, and Japan, offering preferential or duty-free tax rates on exports, especially textiles. The EU’s “Everything But Arms” (EBA) initiative allows Bangladesh to export most goods duty-free, boosting textile exports to the EU. Additionally, Bangladesh’s friendly, multilateral foreign policy with South Asia, the Middle East, and ASEAN regions helps expand export markets and reduce trade barriers, creating more opportunities for businesses sourcing from the country.

4. Support and Incentive Policies from the Government of Bangladesh

The Government of Bangladesh provides various incentives for businesses in special economic zones (SEZs) and export processing zones (EPZs), including 10-year income tax exemptions, import duty exemptions on raw materials, and VAT incentives, reducing business costs. To boost the textile and garment industry, the government offers financial support, and tax incentives, and has developed industrial parks like Savar and Gazipur. Additionally, investments in transport and logistics infrastructure, such as upgrading Chittagong and Mongla Ports and improving highways and airports, enhance cargo handling and reduce logistics costs, making business operations more efficient.

5. Abundant and Experienced Workforce in Textile Production

Bangladesh boasts a young and abundant labour force, with around 65% of the population under 35, providing a steady supply of workers for industries like textiles. Many workers have extensive experience in the garment sector, ensuring high-quality products and efficient production. This skilled workforce is a valuable asset for international companies seeking consistent quality in large-scale production.

6. Strategic Geographic Location

Bangladesh’s geographic proximity to key markets in India, China, and Southeast Asia enables efficient regional supply chains and reduces logistics costs. With seaports like Chittagong and Mongla strategically positioned near major international sea routes, Bangladesh offers shorter lead times and lower transportation costs, enhancing its appeal as a global sourcing hub.

sourcing from bangladesh

Disadvantages of What are the benefits and drawbacks of sourcing from Bangladesh?

While Bangladesh offers significant advantages as a sourcing destination, several challenges can impact business operations. Below is a detailed analysis of the disadvantages:

1. Incomplete Infrastructure

Despite infrastructure investments, Bangladesh’s transport and logistics systems remain underdeveloped and poorly coordinated. Chittagong Port frequently faces congestion, causing delays and inefficiencies. Roads linking manufacturing areas to ports and airports, as well as the railway system, need upgrades to meet international standards. These issues raise logistical costs and reduce supply chain reliability. Traffic congestion and poor synchronization also increase the risk of damage or loss of goods, impacting the timeliness and cost-efficiency of deliveries, which can be a challenge for businesses relying on dependable schedules.
2. Safety and Manufacturing Standards Risks

Bangladesh has a history of industrial accidents, most notably the 2013 Rana Plaza collapse, which killed over 1,100 workers and highlighted poor safety standards in the garment industry. While safety reforms were introduced, many smaller factories still fail to meet proper standards, posing ongoing risks. Additionally, product quality from some Bangladeshi suppliers can be inconsistent, particularly in smaller or uninspected factories, requiring international businesses to invest more in quality control and supplier assessments to ensure compliance with global standards.

3. Complex Bureaucracy and Legal Procedures

Bangladesh’s legal and administrative environment is often complex and bureaucratic, creating challenges for international businesses. Obtaining licenses, setting up factories, and completing customs procedures can be slow and cumbersome due to outdated facilities and limited digital processes at seaports. Legal regulations are frequently inconsistent and subject to change, making compliance difficult and increasing the risk of legal disputes. This lack of transparency adds further complications for businesses operating in the country.

4. Political Instability and Security Risks

In recent years, Bangladesh has experienced political instability, with escalating tensions between the Awami League (AL) and the Bangladesh Nationalist Party (BNP), culminating in major protests and violence in 2024. These disruptions, especially in Dhaka and Chittagong, affected production and the movement of goods. Strikes and blockades pose further risks to supply chains and could increase transportation costs. Additionally, security challenges like organized crime, corruption, and border management issues add to the risks, impacting asset protection, employee safety, and supply chain efficiency for businesses.

Conclusion

Through a detailed analysis of the pros and cons of sourcing goods from Vietnam, India, China, and Bangladesh, several important conclusions can be drawn:

China

  • Advantages: China has large and diverse production capabilities, superior logistics infrastructure, and a highly integrated and complete supply chain. Strong government support for export enterprises and advantages from numerous FTAs with countries and regions worldwide provide significant benefits.
  • Disadvantages: Rising labour costs, ongoing trade tensions with the US and other countries, risks related to intellectual property rights, and geopolitical uncertainties present challenges.
  • Suitable for: High-tech products (electronics, computers, telecommunications equipment), industrial machinery, furniture, fast-moving consumer goods (FMCG), toys, and auto parts.

Vietnam

  • Advantages: Vietnam offers low production costs, stable political conditions, a business-friendly environment, and benefits from multiple Free Trade Agreements (FTAs). It has developed infrastructure, including large seaports that facilitate imports and exports. The country also has a young, highly skilled workforce and diverse climate conditions suitable for both agriculture and industrial production.
  • Disadvantages: Infrastructure is not fully synchronized, and some industries are still dependent on imported raw materials. Additionally, product quality can be uneven across sectors.
  • Suitable for: Textiles, footwear, furniture, assembled electronics, handicrafts, agricultural products, and seafood.

India

  • Advantages: India benefits from low production and labour costs, and abundant and highly skilled human resources in sectors like information technology, textiles, pharmaceuticals, and chemicals. The government strongly supports investment through the “Make in India” initiative, providing tax incentives and an improved business environment.
  • Disadvantages: Incomplete infrastructure, complicated legal procedures, and uneven product quality remain challenges. The business environment can be impacted by bureaucratic procedures and frequent policy changes.
  • Suitable for: Textiles, footwear, pharmaceuticals, information technology, software, and chemicals.

Bangladesh

  • Advantages: Bangladesh offers very low labour costs and is geographically positioned near international shipping routes. It has a strong textile industry with a complete supply chain. The government provides tax incentives and support for export-oriented businesses.
  • Disadvantages: Challenges include incomplete infrastructure, occupational safety risks, political instability, and uneven quality control. Legal procedures are often bureaucratic and time-consuming.
  • Suitable for: Textiles, footwear, and some simple handicrafts.

Sourcing from multiple countries and diversifying the supply chain is the optimal strategy for businesses. Relying on a single country can expose companies to significant risks, such as political upheaval, changes in trade policies, natural disasters, or supply chain disruptions. By diversifying their sourcing strategies across different countries, businesses can better manage risks and take advantage of each country’s unique strengths to build a more resilient and efficient supply chain.

September 18, 2024 0 comment
0 FacebookTwitterLinkedinWhatsapp
top sourcing countries
Market Insights

Overview Top Sourcing Countries In The World

by Henry Truong September 18, 2024
written by Henry Truong

What is global sourcing and why is it important for businesses?

Global sourcing is the strategic process of identifying, evaluating, and procuring goods or services from external suppliers located around the world. This practice is crucial for businesses seeking to optimize costs, enhance product quality, and maintain a stable supply chain by leveraging the unique strengths and resources available in different international markets. By engaging in global sourcing, companies can meet their production and operational needs more efficiently, playing a vital role in effective supply chain management and helping them remain competitive in a dynamic global marketplace.

global sourcing

How has global sourcing evolved over time?

Global sourcing has evolved through three distinct stages, beginning with Stage 1 in 1978 when China initiated economic reforms under Deng Xiaoping. These reforms opened China’s economy to the world, rapidly transforming it into the “World’s Factory.” This period saw global giants like Nike, HP, and IBM establish numerous factories, capitalizing on China’s low production costs and expanding manufacturing capabilities.

Stage 2 emerged with the establishment of the World Trade Organization (WTO) in 1995. This period was marked by economic fluctuations that forced countries to reform their financial structures and attract foreign investment. To stay competitive, nations like Vietnam, Indonesia, and India devalued their currencies, making them appealing alternatives for global companies looking to diversify their supply chains beyond China.

Stage 3 started in the 2000s with the signing of hundreds of Free Trade Agreements (FTAs) between countries and economic blocs. These agreements significantly reduced trade barriers and tariffs, fostering global trade. The COVID-19 pandemic and geopolitical conflicts exposed the fragility of global supply chains, prompting a stronger shift in production to Asian countries like China, Vietnam, Bangladesh, and India. By 2023, the global retail sourcing and procurement market reached $5 billion, with an expected compound annual growth rate (CAGR) of 14.2%.

Which countries are currently the top global sourcing destinations?

China

China remains a global manufacturing powerhouse, contributing 28.7% to the world’s manufacturing output in 2019. It offers a vast, diversified industrial base, especially in electronics, textiles, and machinery. Though labour costs have risen to about $6.50 per hour, China’s strong infrastructure—home to seven of the world’s top 10 busiest container ports—keeps it competitive. However, trade tensions, rising production costs, and concerns about intellectual property make companies consider alternatives, despite China’s $3.59 trillion in exports in 2022.

Vietnam

Vietnam has emerged as a key alternative to China, especially for labour-intensive industries like textiles and electronics. With labour costs around $3.00 per hour and a growing manufacturing sector, Vietnam exported nearly $356 billion worth of goods in 2022. Its extensive Free Trade Agreements (FTAs) have opened doors to markets with over 2 billion consumers, attracting $27.72 billion in foreign direct investment (FDI). However, Vietnam still faces challenges with infrastructure quality, ranking 77th globally.

Understand more about the Pros and Cons of the top of sourcing country: Sourcing from China, Vietnam, India, and Bangladesh: Pros and Cons

top sourcing countries

India

India is a major player in pharmaceuticals, textiles, and IT, producing 20% of the world’s generic drugs and employing 2.7 million people in its pharmaceutical industry. It also exports textiles valued at $223 billion in 2022. India’s “Make in India” initiative has boosted foreign investment, with the manufacturing sector projected to reach $1 trillion by 2025. Despite these strengths, India’s infrastructure and regulatory environment remain hurdles, reflected in its 63rd place on the Ease of Doing Business index.

Bangladesh

Bangladesh has solidified its position as a global leader in the textiles and garments sector, being the world’s second-largest exporter of ready-made garments after China, with exports totalling over $45 billion in 2022. Labour costs in Bangladesh are among the lowest in the world, at around $1.50 per hour, making it an attractive destination for clothing brands. The garment industry employs over 4 million workers, contributing to nearly 84% of the country’s total exports. However, Bangladesh faces challenges with workplace safety, limited diversification beyond textiles, and inadequate infrastructure, which can hinder long-term growth.

Mexico

Mexico’s proximity to the U.S. and its participation in the USMCA makes it a key nearshoring destination, with 80% of its exports going to the U.S. In 2022, Mexico’s exports totalled $578 billion, driven by industries like automotive and electronics. Labour costs remain competitive at about $4.50 per hour, making it attractive for North American companies. As the 7th largest car manufacturer globally, Mexico produces 3 million vehicles annually, although security concerns and rising labour costs in some regions pose challenges.

Conclusion

The global sourcing landscape is shaped by the strengths and challenges of countries like China, Vietnam, India, and Bangladesh. Each of these nations has developed unique competitive advantages, from China’s massive manufacturing capabilities to Bangladesh’s dominance in the garment industry. However, businesses must also consider the infrastructure, regulatory environments, and rising costs as they decide on sourcing partners. As the world continues to evolve, global sourcing strategies will need to adapt to changing economic and political conditions, ensuring companies remain competitive in a dynamic global marketplace.

See more:

  • Global Sourcing: Trends Shaping the Future
  • Best Practices for Sourcing a Global Supplier Network
September 18, 2024 0 comment
0 FacebookTwitterLinkedinWhatsapp
vietnam coffe export
Food & Spicy Industry

Vietnam’s Coffee Industry: A Global Coffee Export Powerhouse

by Henry Truong September 15, 2024
written by Henry Truong

Why is Vietnam so important in the global coffee market?

Vietnam has rapidly ascended to become an indispensable force in the global coffee landscape.  From relatively modest beginnings, the nation has transformed into the world’s second-largest coffee producer and the undisputed leader in robusta coffee output. This remarkable rise is not merely an economic statistic; coffee cultivation is deeply intertwined with Vietnam’s socio-economic fabric, providing livelihoods for millions of rural households, particularly in the Central Highlands. It stands as a critical source of foreign exchange, underpinning significant national development. The robust nature and distinctive flavor profile of Vietnamese robusta have carved a unique niche, impacting supply chains and consumer preferences worldwide. This article will delve into the intricate details of Vietnam’s coffee sector, examining its production data, key growing regions, cultivation practices, and processing methods, ultimately offering an outlook on its future trends and global impact towards 2025 and beyond. Understanding these fundamental figures and operational aspects is essential to grasp the true scale of Vietnam’s contribution to the world’s daily cup.

How much coffee does Vietnam produce each year?

Vietnam consistently produces a substantial amount of coffee each year, holding its position as the world’s second-largest producer, trailing only Brazil. The country also commands an overwhelming share of the global robusta market, making its annual output critical for international coffee markets, as fluctuations can significantly impact global prices and supply.

Annual Output (2020-2025 Forecast):

Marketing Year (Oct-Sep)Production (Thousand Tonnes)Production (Million 60kg Bags)
2019/20201,73028.8
2020/20211,82030.3
2021/20221,76029.3
2022/20231,84030.7
2023/2024 (Est.)1,78029.7
2024/2025 (Forecast)1,85030.8

(Source: Data adapted and forecast based on reports from USDA Foreign Agricultural Service, VICOFA, and the Ministry of Agriculture and Rural Development)

Year-over-Year Trends:
Production volumes in Vietnam have shown resilience and a general upward trend over the past five years, albeit with some annual fluctuations. For instance, while 2022/2023 saw a robust output driven by favorable weather and farmer investment, the 2023/2024 estimated figures reflect the impact of adverse climate conditions, particularly droughts in key growing regions, which can temporarily reduce yields. The forecast for 2024/2025 anticipates a recovery, assuming more stable weather patterns and continued efforts in efficient cultivation. Key drivers for growth include consistent farmer investment in irrigation and robusta’s inherent high-yield nature, while challenges largely stem from unpredictable climate events and global commodity price volatility.

Robusta vs. Arabica Breakdown:
Vietnamese coffee production is overwhelmingly dominated by robusta beans, accounting for over 95% of the national output. Arabica, while a smaller segment, is gradually expanding, particularly in niche, high-altitude areas. This composition highlights Vietnam’s strategic importance as the primary supplier of robusta to the world, used extensively in instant coffee blends and as an essential component for espresso to enhance crema.

Comparative Summary:
In comparison to other major producers, Vietnam’s robusta dominance sets it apart. Brazil, the largest overall producer, has a more diversified output with significant robusta (Conilon) and arabica production. Colombia, on the other hand, is almost exclusively known for its high-quality arabica. Vietnam’s consistent output of robusta, typically yielding around 30 million 60kg bags annually, underscores its critical role in stabilizing global robusta supplies and influencing market dynamics for this specific bean type.

Where are Vietnam’s main coffee growing regions?

Vietnam’s main coffee growing regions are concentrated in specific geographical zones, where unique environmental conditions create ideal growing environments, particularly for robusta. These areas are crucial for the country’s position as a global coffee powerhouse.

Central Highlands Overview:
The Central Highlands (Tây Nguyên) region is undeniably the epicenter of Vietnam’s coffee industry, contributing over 90% of the nation’s total output. This vital region spans several provinces, each playing a crucial role in the country’s coffee production.

Principal Provinces:

  • Dak Lak: The largest coffee-producing province in Vietnam, Dak Lak is often referred to as the “coffee capital.” Its rich basaltic red soil and favorable climate conditions are perfectly suited for robusta cultivation. Buon Ma Thuot, the provincial capital, is a central hub for coffee trade and processing.
  • Lam Dong: While also a significant robusta producer, Lam Dong, particularly around Da Lat, is notable for cultivating a larger share of arabica varieties due to its higher altitudes and cooler climate. This province is at the forefront of Vietnam’s specialty coffee development.
  • Gia Lai: Another key robusta stronghold, Gia Lai benefits from similar volcanic soils and climatic patterns to Dak Lak, contributing substantially to the overall robusta volume.
  • Kon Tum: Located in the northern part of the Central Highlands, Kon Tum also focuses on robusta, though its production scale is somewhat smaller than its southern neighbors.
  • Dak Nong: Sharing borders with Cambodia and other Central Highlands provinces, Dak Nong is another significant robusta producer, benefiting from extensive basaltic land.

Environmental Factors:
The Central Highlands’ success lies in its distinct environmental advantages:

  • Basaltic Red Soil: Derived from ancient volcanic activity, these soils are exceptionally fertile, deep, and well-drained, providing excellent conditions for coffee roots.
  • Climate: The region experiences a tropical monsoon climate with distinct wet and dry seasons. The abundant rainfall during the growing season (May-October) and the dry, sunny period for harvesting (November-April) are ideal for robusta.
  • Altitude: While much of the Central Highlands is suitable for robusta (typically grown at lower to mid-altitudes), higher elevations in provinces like Lam Dong offer the cooler temperatures and mist favored by arabica.

Production Share by Province:
While precise real-time data varies, Dak Lak consistently leads, often accounting for 30-40% of national output, followed by Gia Lai and Lam Dong, each contributing significant percentages, showcasing the highly concentrated nature of Vietnamese coffee production within these heartlands.

Emerging or Niche Regions:
Beyond the Central Highlands, smaller, emerging regions are gaining recognition for specialty arabica cultivation. Northern mountainous provinces like Son La and Dien Bien, with their unique microclimates and higher altitudes, are increasingly exploring arabica varieties such as Catimor, producing beans with distinct flavor profiles that cater to niche global markets. These regions represent a strategic diversification for Vietnam’s coffee sector.

What types of coffee beans does Vietnam grow?

Vietnam’s coffee production is fundamentally shaped by the types of beans cultivated, with robusta playing an overwhelming role due to specific geographical and economic factors. The country primarily grows robusta, which accounts for over 95% of its coffee output, alongside a growing, albeit smaller, segment of arabica.

Robusta Dominance:
Robusta (Coffea canephora) accounts for over 95% of Vietnam’s coffee production for several compelling reasons:

  • Climate Suitability: Robusta thrives in Vietnam’s hot, humid, and relatively lower-altitude conditions, particularly in the Central Highlands, where arabica would struggle.
  • Higher Yield: Robusta plants generally produce significantly higher yields per hectare compared to arabica, making it a more economically viable crop for smallholder farmers.
  • Pest and Disease Resistance: Robusta is more resilient to common coffee diseases and pests, reducing crop loss and the need for intensive pest management.
  • Economic History: Post-war agricultural policies heavily favored robusta for its export potential, establishing a deeply ingrained production infrastructure.

Robusta Characteristics for Cultivation:
Vietnamese robusta trees are typically hardy, growing into strong, large shrubs or small trees. They flower after the first significant rains following the dry season, with cherries ripening over several months, usually from November to April. Their resilience means they can withstand harsher conditions and require less meticulous care than arabica, making them well-suited to the extensive smallholder farming model prevalent in Vietnam. Harvesting often involves “strip picking,” where all cherries on a branch are picked at once, reflecting the focus on volume.

Arabica Cultivation:
While a minority, arabica (Coffea arabica) cultivation is a growing segment, primarily in higher-altitude areas. Key sub-varieties grown include:

  • Catimor: A hybrid variety known for its disease resistance and high yield, it is the most commonly planted arabica in Vietnam, particularly in Lam Dong (Da Lat) and some northern provinces like Son La.
  • Bourbon, Typica, and Moka (a Typica sub-variety): These classic arabica varieties are grown in very specific, high-altitude microclimates in Lam Dong, offering more complex flavor profiles but demanding greater care and lower yields. Efforts are focused on preserving these heirloom varieties for specialty markets.

Speciality and Premium Varieties Development:
There’s a discernible trend towards cultivating higher-quality and speciality coffee beans in Vietnam. This involves:

  • Improved Varietals: Research into new robusta clones that offer better cup quality while maintaining yield and disease resistance.
  • Micro-Lot Development: Farmers and cooperatives are segmenting their harvests, focusing on specific plots with unique terroir to produce premium small batches.
  • Targeted Cultivation Practices: Implementing shade-grown methods for arabica, precise fertilization, and careful canopy management to enhance bean quality.
  • Post-Harvest Improvements: Significant investment in better processing infrastructure for arabica and specialty robusta to unlock their full flavor potential.

Bean Suitability for Processing:
The inherent characteristics of robusta and arabica directly influence processing. Robusta’s denser, lower-acidity profile, often with a higher sugar content, lends itself well to the traditional dry (natural) processing method, which can impart strong, earthy, and chocolatey notes. Arabica, with its higher acidity and more delicate aromatics, benefits significantly from wet (washed) processing, which highlights its cleaner, brighter, and more nuanced flavors. The developing honey processing method seeks to balance these attributes for specialty robusta and certain arabicas.

How is coffee grown, harvested, and processed in Vietnam?

The journey of Vietnamese coffee, from a cherry on a tree to a green bean ready for export, involves distinct cultivation, harvesting, and processing practices. Many of these methods are evolving towards greater efficiency and sustainability, ensuring the quality and consistency of Vietnamese coffee for global markets.

Cultivation Cycles:
The annual coffee cycle in Vietnam typically begins with flowering after the first significant rains, usually in March-April, following the dry season. Cherries then develop and ripen over several months, with the main harvest season commencing in late October or November and extending through January or February in the Central Highlands. Farmers meticulously manage irrigation during the dry season, a critical factor given the region’s climate.

Agricultural Practices:
Vietnamese coffee farming, predominantly carried out by smallholder farmers, historically relied on traditional manual techniques. However, there’s a strong push towards modernization and sustainable practices:

  • Traditional Methods: Manual weeding, pruning, and hand-picking remain common, particularly on smaller plots and for quality-focused arabica.
  • Modernization Efforts:
    • Mechanization: Automated drip irrigation systems are increasingly adopted to conserve water, especially crucial during dry spells. Limited mechanization for harvesting and initial sorting is also emerging in larger farms.
    • Improved Fertilizer Use: Farmers are being educated on balanced fertilization to enhance soil health and plant productivity.
    • Pest Management: Integrated Pest Management (IPM) strategies are promoted to minimize chemical use while effectively controlling pests and diseases.
  • Sustainable Farming Methods: Vietnam is actively embracing global sustainability standards:
    • Certifications: Widespread adoption of certifications like Rainforest Alliance, 4C (Common Code for the Coffee Community), and Fairtrade, which encourage environmentally sound and socially equitable practices, directly impacting how coffee is grown and handled on certified farms.
    • Water Conservation: Techniques such as efficient irrigation and mulching are implemented to reduce water consumption.
    • Shade-Grown Coffee: Promoting the cultivation of coffee under shade trees, especially for arabica, which benefits biodiversity and soil health.
    • Intercropping: Growing other crops (e.g., pepper, fruit trees) alongside coffee, which improves soil fertility, provides additional income, and enhances biodiversity.

Harvesting Techniques:

  • Strip Picking (Robusta): The most prevalent method for robusta, where all cherries on a branch, regardless of ripeness, are stripped off. This method is efficient for large volumes but requires careful post-harvest sorting to ensure quality.
  • Selective Picking (Arabica): For higher-quality arabica and specialty robusta, farmers employ selective picking, where only ripe cherries are hand-picked over multiple passes. This labor-intensive method yields superior quality beans.

Processing Styles and Export Relevance:
Post-harvest processing is crucial in determining the quality and flavor profile of the green beans for export.

  • Dry (Natural) Processing: This traditional and most common method for robusta involves spreading coffee cherries on large concrete patios to sun-dry for several weeks. The fruit pulp ferments around the bean, imparting robust, full-bodied, often earthy, chocolatey, and nutty notes. The resulting green beans are typically used for blends, instant coffee, and espresso.
  • Wet (Washed) Processing: Growing in adoption for arabica and premium robusta, this method involves de-pulping the cherries, fermenting them to remove mucilage, washing them clean, and then drying the parchment coffee. This yields a cleaner, brighter, and more acidic cup profile, highly sought after in specialty markets.
  • Honey Processing: A hybrid method, it involves de-pulping but leaving a controlled amount of mucilage on the bean to dry. This method, often used for specialty robusta and arabica, aims to create a balance of sweetness and cleanliness, offering complex fruit and honey-like notes. The choice of processing method directly influences the characteristics of the green beans available to international importers, dictating their suitability for different roasts and end products.

6. Structure of the Industry: Vietnam’s Coffee Industry Value Chain (Upstream & Midstream)

Vietnam’s coffee industry is structured around a robust value chain, particularly in its upstream and midstream segments. This structure is characterized by a strong smallholder farmer base, evolving processing capabilities, and a comprehensive network of domestic traders that facilitate the coffee’s journey to global markets.

Farming Sector:

  • Scale and Farm Sizes: The bedrock of Vietnamese coffee production is its smallholder farming community. Approximately 95% of coffee farms are small-scale, typically ranging from 0.5 to 3 hectares. These family-owned plots cultivate the vast majority of the nation’s coffee. While larger estates exist, they are less common than in some other coffee-producing nations.
  • Organization: Farmer cooperatives and associations play a vital role in supporting this fragmented farming sector. Organizations like the Vietnam Coffee-Cocoa Association (VICOFA) act as central bodies, providing technical training, disseminating market information, and facilitating access to financing and agricultural inputs. Crucially, cooperatives also help aggregate smallholders’ output, giving them better leverage in selling their raw cherries or parchment coffee to processors and exporters. This collective approach strengthens farmers’ positions in the value chain.

Primary Processing Sector:

  • Local Value Addition: There has been a significant expansion of local processing capabilities beyond merely producing raw green beans. Vietnam’s midstream sector has invested heavily in facilities for roasting, grinding, and the manufacturing of soluble (instant) coffee. This shift indicates a strategic move to capture more value domestically rather than exporting only raw commodities.
  • Investment in Technology: To enhance quality and efficiency, processors are continually investing in modern technologies. This includes advanced drying systems, precise sorting and grading machinery (optical sorters), and sophisticated roasting equipment. Such investments are crucial for meeting stringent international quality standards and producing differentiated products.
  • Role of Processors: Local processors are pivotal intermediaries. They purchase coffee cherries or wet parchment from farmers, conduct initial processing (drying, hulling), and then often sell the green beans to larger export companies or further process them into roasted or instant coffee for both the domestic market and international trade. Major Vietnamese coffee companies like Trung Nguyen and Vinacafe, while well-known for their consumer brands, also operate extensive processing facilities that contribute significantly to this midstream segment.

Trading and Export Logistics (Initial Stage):

  • Key Players: The initial stages of trading involve numerous domestic traders and aggregators. These players operate at the local level, collecting coffee from individual farmers or cooperatives. They often provide pre-financing or inputs to farmers, securing harvests. Their role is to consolidate smaller lots into larger volumes suitable for bulk transport.
  • Logistics Infrastructure: Vietnam has continuously improved its logistics infrastructure to support the coffee industry. This includes a network of local warehouses, collection points, and transport routes connecting the Central Highlands to major port cities such as Ho Chi Minh City, Quy Nhon, and Hai Phong. Efficient infrastructure is essential to move millions of tons of coffee annually from remote farms to processing centers and, eventually, to international shipping hubs.

Which countries import coffee from Vietnam?

Vietnam’s robusta coffee is a cornerstone of global supply, reaching diverse markets worldwide. Its export performance is a critical indicator of the health and competitiveness of the nation’s agricultural trade, with major destinations including the European Union, the United States, China, and Japan, among others.

Major Export Destinations:
Vietnam’s coffee primarily targets markets that value robusta for its cost-effectiveness, strong flavor, and caffeine content, particularly for blends and instant coffee production.

  • European Union (EU): Consistently the largest importer, accounting for a significant share (e.g., 35-40%) of Vietnam’s coffee exports. Countries like Germany, Italy, Spain, and Belgium are key destinations, leveraging robusta for espresso blends and soluble coffee.
  • United States (US): A substantial market, though often with a preference for arabica, the US imports considerable volumes of Vietnamese robusta for its diverse coffee industry.
  • China: A rapidly growing market for Vietnamese coffee, driven by increasing domestic coffee consumption and the expansion of coffee shop chains.
  • Japan: A consistent and quality-conscious market, importing Vietnamese coffee for both instant and roasted blends.
  • Southeast Asia: Regional markets, including the Philippines and Indonesia, are important destinations, reflecting intra-ASEAN trade.
  • Russia: A significant market for instant coffee, heavily relying on Vietnamese robusta.

Export Volume/Value Trends (2020-2025 Forecast):
Vietnamese coffee exports have demonstrated impressive growth, with values often setting new records.

Marketing Year (Oct-Sep)Export Volume (Million 60kg Bags)Export Value (Billion USD)
2019/202028.12.8
2020/202129.53.1
2021/202227.83.9
2022/202328.54.6
2023/2024 (Est.)26.55.2
2024/2025 (Forecast)28.05.8 – 6.0

(Source: Forecast data based on market trends and reports from USDA, VICOFA. Note: 2024/2025 values are highly sensitive to global prices and domestic supply.)

The value of exports has surged significantly even with some volume fluctuations, largely due to rising global robusta prices. Forecasts for 2025 suggest continued strong export earnings, potentially exceeding $5.8-$6.0 billion, driven by sustained global demand and the ongoing premiumization of robusta.

Factors Influencing Trade:

  • International Coffee Prices: Global robusta prices, largely dictated by ICE Futures Robusta contracts, are a primary driver of Vietnam’s export value. Spot market prices for green robusta also play a significant role.
  • Global Supply-Demand Dynamics: Changes in supply from other major robusta producers (e.g., Brazil, Indonesia) or shifts in global coffee consumption directly impact demand for Vietnamese beans.
  • Currency Fluctuations: The strength of the Vietnamese Dong against major currencies (USD, EUR) influences the price competitiveness of Vietnamese coffee on international markets.

Trade Agreements and Policies:
Vietnam’s network of Free Trade Agreements (FTAs) has been instrumental in optimizing the export of its coffee:

  • EU-Vietnam Free Trade Agreement (EVFTA): This agreement has significantly reduced tariffs on Vietnamese coffee entering the EU market, providing a competitive edge and boosting exports to its largest destination. For processed coffee products, tariffs have been largely eliminated, incentivizing value-added exports.
  • Comprehensive and Progressive Agreement for Trans-Pacific Partnership (CPTPP): This agreement offers preferential access to markets like Japan, Canada, and Australia, facilitating lower tariffs and smoother trade flows for Vietnamese coffee products. These agreements directly lower the cost for importers, making Vietnamese coffee more attractive.

Growth Segments:
Beyond raw green robusta, Vietnam is seeing export growth in value-added products and specialty beans. Roasted and ground coffee, as well as instant coffee, are increasingly being exported, moving Vietnam up the value chain. There’s also a growing international appetite for Vietnamese specialty robusta and niche arabica, reflecting a global trend towards diversified coffee experiences that directly benefit from Vietnamese producers’ quality improvement efforts.

How does the coffee industry impact Vietnam’s economy and society?

The coffee industry profoundly impacts Vietnam’s economy and society, serving as a fundamental pillar of the nation’s socio-economic development. It significantly influences rural livelihoods, national income, and poverty reduction, extending beyond a mere agricultural sector to become a vital component of the country’s progress.

GDP Contribution:
The coffee sector makes a substantial direct and indirect contribution to Vietnam’s Gross Domestic Product (GDP). Directly, it contributes through agricultural output, processing, and export revenues. Indirectly, it stimulates growth in related sectors such as logistics, packaging, machinery manufacturing, and service industries in coffee-growing regions. While its exact percentage contribution fluctuates with global prices, it remains one of the top agricultural commodities driving the national economy.

Foreign Exchange Earnings:
Coffee exports are a consistent and significant source of foreign currency for Vietnam. As one of the country’s leading export commodities, the substantial USD and EUR earnings generated from international sales are crucial for maintaining a healthy balance of trade, financing imports, and bolstering national reserves. This inflow of foreign exchange is vital for Vietnam’s economic stability and growth, funding various development projects across the country.

Livelihoods and Rural Employment:
The coffee industry is a primary employer in rural Vietnam. Estimates suggest that coffee cultivation provides direct and indirect employment for over 2.6 million people, primarily in the Central Highlands. Millions of smallholder farmers and their families depend almost entirely on coffee for their income, making the sector’s stability directly linked to their economic well-being. This widespread employment extends to harvesting, processing, and local trading activities.

Poverty Reduction and Rural Development:
The expansion and success of the coffee sector have played a critical role in poverty reduction, particularly in the historically disadvantaged Central Highlands. By providing a reliable cash crop, coffee cultivation has enabled farmers to invest in education, healthcare, and better housing, significantly improving living standards in these rural areas. Infrastructure development, such as roads and irrigation systems, has also been spurred by the needs of the coffee industry, further contributing to rural development.

Government and Industry Stakeholder Roles:
The Vietnamese government, alongside industry associations like VICOFA, plays a crucial role in sustaining and growing the coffee sector:

  • Policy Support: Government policies provide farmers with technical assistance, access to credit, and land use planning to optimize coffee cultivation.
  • Infrastructure Investment: Continuous investment in irrigation systems, transportation networks, and processing facilities supports efficiency and quality improvements.
  • Market Stabilization: VICOFA actively works to promote Vietnamese coffee, negotiate trade terms, and provide market intelligence to farmers and exporters, aiming to stabilize prices and ensure fair returns.
  • Sustainability Initiatives: Both government and industry stakeholders champion sustainable farming practices and international certifications, ensuring the long-term viability of the sector and access to environmentally conscious markets. These concerted efforts are vital for the continued prosperity of Vietnam’s coffee industry and its positive impact on national development.

What are the future trends and challenges for Vietnam’s coffee industry?

As Vietnam solidifies its position as a global coffee powerhouse, its industry is continually adapting to evolving global demands and facing significant modern challenges. These include climate change, the need for higher quality, and shifts towards specialty and value-added production. The outlook for 2025 and beyond hinges on strategic shifts and technological adoption to ensure sustainable growth and competitiveness.

Shifts Towards Specialty and Value-Added Production:
A primary trend is the concerted effort among Vietnamese producers to move up the value chain. This involves:

  • Enhanced Cultivation: Focusing on single-origin robusta and specific arabica varietals with distinct flavor profiles, moving beyond bulk commodity production.
  • Advanced Processing: Investing in wet and honey processing methods to create cleaner, more complex, and higher-quality green beans that fetch premium prices in specialty markets.
  • Branding and Storytelling: Producers are increasingly focused on highlighting the unique terroir and sustainable practices of their farms to appeal to discerning international buyers.

Sustainability and Climate Adaptation Efforts:
Climate change poses an existential threat to Vietnam’s coffee production, with farmers already grappling with increased frequency and intensity of droughts, erratic rainfall patterns, and rising temperatures.

  • Challenges: Water scarcity is a critical issue in the Central Highlands, leading to competition for resources. Soil degradation from intensive farming practices is another pressing concern.
  • Adaptation Strategies:
    • Drought-Resistant Varieties: Research and deployment of new coffee varieties more tolerant to water stress.
    • Efficient Irrigation: Widespread adoption of micro-irrigation and smart watering systems to conserve water.
    • Shade Management: Promoting agroforestry and planting shade trees to reduce water evaporation, regulate temperature, and enhance biodiversity.
    • Soil Health Programs: Implementing organic fertilization, cover cropping, and intercropping to improve soil structure and nutrient retention.

Quality Improvement and International Certification:
Meeting global standards is paramount for market access and premiumization:

  • Post-Harvest Handling: Significant efforts are being made to improve drying, sorting, and storage facilities to minimize defects and enhance consistency. This includes training farmers on best practices for picking only ripe cherries.
  • Cultivation Practices: Adoption of VietGAP (Vietnamese Good Agricultural Practices) and international certifications like Rainforest Alliance, 4C, and Fairtrade ensures compliance with global environmental and social standards, opening doors to ethical and high-value markets. These certifications act as a credible assurance of quality and responsible production.

Investment in R&D and Smart Agriculture Technologies:
Innovation is key to future resilience and efficiency:

  • Research and Development: Government and private sector investments in developing new, disease-resistant, and high-yielding coffee varieties specifically adapted to Vietnamese conditions.
  • Smart Farming: The adoption of technologies like IoT sensors for soil moisture and nutrient monitoring, AI-powered crop health analysis, and drone-based precision agriculture for targeted fertilizer and pest application. These technologies aim to optimize resource use, reduce costs, and improve yields in a sustainable manner.

Labor and Farmer Well-being:
The industry also faces socio-economic challenges:

  • Labor Shortages: Rural-to-urban migration can lead to labor shortages during peak harvest seasons.
  • Fair Pricing: Ensuring that farmers receive a fair share of the value chain is critical for sustainable development. Initiatives focus on direct trade models and cooperative empowerment.
  • Welfare Programs: Programs aimed at improving farmer education, access to healthcare, and community development are integral to the long-term health of the coffee sector.

10. Breaking News & Noteworthy Developments (2023-2025)

The Vietnamese coffee sector has experienced dynamic shifts and strategic responses in the 2023-2025 period, shaped by both environmental pressures and market opportunities. These latest developments include significant impacts from droughts, international price surges, and new government and private-sector initiatives aimed at sustainable growth and quality improvement.

Recent Output and Pricing Dynamics:

  • 2023-2024 Drought Impacts: The 2023-2024 harvest was significantly affected by prolonged droughts in the Central Highlands, with reservoir levels dropping sharply. This led to a notable reduction in robusta yields, impacting the global robusta supply. Domestic coffee prices surged to unprecedented levels, reflecting the tight supply and strong international demand. Farmers, while benefiting from higher prices, faced challenges in maintaining yields due to water stress.
  • International Price Surge: Global robusta prices on the ICE Futures exchange reached multi-year highs in early 2024, directly benefiting Vietnamese exporters but also creating price volatility. Forecasts for late 2024 and 2025 suggest continued strong prices, albeit with potential normalization if favorable weather returns and global supply stabilizes.

Weather Impacts (2023-2024):
The 2023-2024 dry season was particularly severe, with less-than-average rainfall and higher-than-normal temperatures. This directly impacted coffee cherry development, leading to smaller bean sizes and a lower overall yield compared to previous years. Water management became a critical issue for farmers, with many relying heavily on groundwater. This weather event has intensified calls for long-term climate adaptation strategies within the industry.

Notable Government or Private-Sector Initiatives:

  • National Coffee Development Strategy: In late 2023, the Ministry of Agriculture and Rural Development (MARD) unveiled an updated national strategy focusing on sustainable coffee development. Key pillars include promoting high-quality robusta varieties, expanding arabica cultivation in suitable areas, and investing in advanced processing technologies. The strategy aims to increase the value of Vietnamese coffee exports and enhance farmers’ incomes.
  • EU-Funded Sustainability Programs: Several new programs, backed by EU funding under the EVFTA framework, were launched in 2024. These initiatives focus on providing technical assistance to farmers for sustainable practices (e.g., water-efficient irrigation, organic fertilization), securing international certifications (Rainforest Alliance, 4C), and developing specialized robusta micro-lots for premium markets.
  • Private Sector Investment in Processing: Major Vietnamese processors and international buyers have announced significant investments in modern roasting and instant coffee production facilities. For instance, a notable investment by a leading Vietnamese company in Dak Lak in mid-2024 aims to expand its soluble coffee production capacity by 20%, catering to growing global demand for instant coffee.

Effects of Global Market Fluctuations:
The global economic slowdown in 2023 had a mixed impact. While overall demand remained robust, some markets experienced reduced purchasing power. However, the tight global robusta supply, partly due to Vietnam’s weather challenges, sustained high prices. Trade agreements like the EVFTA continued to provide a stable framework, ensuring Vietnamese coffee maintained preferential access to key European markets despite broader economic uncertainties, significantly bolstering the 2025 export outlook.

Technological Adoptions:
The 2023-2025 period saw increased adoption of smart agriculture technologies. Pilot projects demonstrating IoT-based sensors for precision irrigation and soil nutrient management expanded across several cooperatives in Dak Lak and Lam Dong. Furthermore, the use of drones for crop health monitoring and targeted pest control gained traction, indicating a proactive approach by a growing number of producers towards modernizing farming practices to improve efficiency and reduce environmental impact.

How did Vietnam’s coffee industry develop over time?

The journey of coffee in Vietnam is a compelling narrative of agricultural transformation, from its colonial introduction to becoming a global economic powerhouse. The industry developed over time through key phases, including French colonial influence, post-war government initiatives, and a strategic shift from quantity to quality, shaping its current prominence.

Origins of Coffee in Vietnam:
Coffee was first introduced to Vietnam by French missionaries in 1857, initially with arabica varieties planted in northern provinces. However, large-scale commercial cultivation truly began in the late 19th and early 20th centuries during the French colonial era. The French recognized the fertile basaltic soils and favorable climate of the Central Highlands, particularly around Buon Ma Thuot, as ideal for robusta coffee. Plantations were established, laying the groundwork for what would become Vietnam’s dominant crop.

Post-War Development:
After the end of the Vietnam War in 1975 and the subsequent reunification, the government identified coffee as a strategic crop for economic recovery and foreign exchange generation. During the 1980s, under the “Doi Moi” (Renovation) economic reforms, significant state investment and policies encouraged widespread coffee cultivation, particularly robusta, through collectivized farms and later, smallholder land allocations. This period saw rapid expansion of coffee acreage, especially in the Central Highlands, transforming vast tracts of land into coffee farms.

Key Milestones in Production Growth:

  • 1990s Boom: Vietnam experienced an explosive growth in coffee production in the 1990s. From producing barely 1% of the world’s coffee in 1990, it surged to become the second-largest producer by the early 2000s, driven almost entirely by robusta. This rapid expansion was fueled by favorable global prices, available land, and government support.
  • Infrastructure Development: Alongside cultivation, there was significant development in processing and export infrastructure, including warehouses, drying facilities, and transportation networks, to handle the enormous volumes of green beans.
  • Integration into Global Markets: Vietnam’s consistent supply of robusta fundamentally altered global coffee markets, providing a reliable and cost-effective source for blenders and instant coffee manufacturers worldwide.

Shift from Quantity to Quality (Historical Context):
Initially, the focus was overwhelmingly on quantity to maximize foreign exchange. This led to criticism regarding the quality of some Vietnamese robusta. However, in the late 2000s and into the 2010s, a strategic shift began. The industry, supported by government initiatives and international collaborations, started emphasizing quality improvement, sustainable practices, and value addition. This historical transition from purely volume-driven production to an increasing focus on quality and specialty coffee laid the foundation for the current trends and future pathways discussed today, aiming to enhance the reputation and economic value of Vietnamese coffee on the global stage.

Common Questions About Vietnamese Coffee Production

Is Vietnam increasing its coffee production?

Yes, Vietnam generally aims to maintain or slightly increase its coffee production. While annual yields can fluctuate due to weather, the overall trend reflects continued investment in cultivation and processing. The 2024/2025 forecast anticipates a recovery in production, striving for consistency around 30 million 60kg bags annually, driven by efficient farming and market demand.

Is Vietnamese coffee sustainable?

Vietnamese coffee is increasingly sustainable. Significant efforts are underway to adopt environmentally friendly and socially responsible practices. Many farms hold international certifications (Rainforest Alliance, 4C, Fairtrade), focusing on water conservation, soil health, and fair labor. While challenges remain, the industry is committed to sustainable growth.

What is the primary type of coffee bean produced in Vietnam?

The primary type of coffee bean produced in Vietnam is Robusta (Coffea canephora). It accounts for over 95% of the national output, thriving in the country’s hot, humid climate and fertile basaltic soils, particularly in the Central Highlands. Robusta is favored for its high yield, resilience, and strong flavor profile, making it a staple for instant coffee and espresso blends.

What are the Central Highlands known for in Vietnamese coffee production?

The Central Highlands are the heartland of Vietnamese coffee production, responsible for over 90% of the national output. This region is renowned for its ideal conditions for robusta cultivation, including rich basaltic red soil, abundant rainfall, and suitable temperatures. Provinces like Dak Lak, Lam Dong, and Gia Lai are key contributors, making it a critical global coffee hub.

Which countries are the largest importers of Vietnamese coffee?

The largest importers of Vietnamese coffee are consistently the European Union (EU), the United States, and China. The EU, with countries like Germany and Italy, is the top destination, leveraging robusta for blends. China’s rapidly growing market and the US also represent significant demand, driven by both traditional coffee use and rising consumption trends.

What are the main processing methods used for Vietnamese coffee?

The main processing methods used for Vietnamese coffee are dry (natural) processing, especially for robusta, and wet (washed) processing, which is increasingly adopted for arabica and specialty robusta. Dry processing involves sun-drying cherries, imparting robust, earthy notes. Wet processing removes pulp before drying, resulting in a cleaner, brighter cup. Honey processing is also emerging for specialty beans.

How does Vietnam’s coffee yield compare to Brazil’s?

Vietnam’s robusta yields per hectare are generally among the highest globally due to favorable conditions and intensive cultivation. While Brazil is the overall largest producer, its output includes both robusta and arabica across a much larger land area. Vietnam’s efficiency in robusta production, focusing on fewer but highly productive regions, gives it a competitive edge in specific segments.

What distinguishes Vietnamese robusta cultivation from other robusta-producing countries?

Vietnamese robusta cultivation is distinguished by its scale, concentrated geographical heartland (Central Highlands), and the extensive network of smallholder farmers. The unique basaltic soil and specific wet-dry monsoon climate provide optimal conditions. Additionally, significant government support and a historical focus on robusta for export have led to highly efficient and specialized production practices compared to other robusta-producing nations.

See more:

  • Why Vietnam is a Top Choice for Coffee Sourcing
  • Vietnamese Coffee: Ultimate Guide to History, Brews & Global Impact
September 15, 2024 0 comment
0 FacebookTwitterLinkedinWhatsapp
Market Insights

Best Practices for Sourcing a Global Supplier Network

by Henry Truong September 7, 2024
written by Henry Truong

Expanding sourcing globally enables companies to access specialized techniques unavailable domestically, enhancing product quality and competitiveness. Companies can also transfer technology to developing countries, leveraging lower labour costs to scale operations, as seen with major corporations like Apple, Samsung, and Intel. Below are some best practices to streamline your sourcing efforts:

How can online B2B platforms help find global suppliers?

Online Business-to-Business (B2B) platforms are powerful tools for connecting with international suppliers, offering a robust environment to expand your sourcing reach. These platforms provide access to a vast network of manufacturers and distributors worldwide, streamlining the process of identifying potential partners. Below, we explore some of the most popular platforms and their key features.

  • Alibaba.com: The world’s largest B2B platform, mainly connecting with Chinese suppliers but also globally. It offers features like Verified Supplier, Trade Assurance, Product Customization, and RFQ (Request for Quotation). While it provides a wide selection and buyer protection, quality can vary, and there are risks of fraud.
  • Global Sources: Focuses on Asian suppliers, with a strong database for electronics, industrial equipment, and high-tech industries. It provides Supplier Ranking, Verified Manufacturers, and Industry Events. However, it is costly to attend events, and the focus is primarily on Asia.
  • Made-in-China.com: Specializes in Chinese suppliers with a strong focus on quality and manufacturing sectors like heavy industry. It offers Audit Reports, Custom Products, and information on Trade Shows. Communication may be challenging due to language barriers.
  • Kompass.com: A global supplier database that includes regions beyond Asia, offering detailed Company Profiles, Product Showcases, and a Business Directory. It’s best for large enterprises, but access to some services may require a fee.
  • TradeIndia: A leading platform in India that provides comprehensive supplier information and Verified Suppliers. While it focuses on the Indian market and supports multiple languages, the quality among suppliers can be inconsistent.

Why should you attend international trade fairs for sourcing?

Attending international trade fairs is a highly effective strategy for discovering and establishing direct relationships with suppliers from around the globe. These events offer unique, in-person opportunities to engage with potential partners, evaluate products firsthand, negotiate contract terms, and stay informed about the latest market trends and innovations. This direct interaction can build trust and provide insights that online platforms cannot. Below is a list of major trade fairs in key sourcing countries like China, India, Vietnam, and Indonesia.

  • China: Canton Fair, CIFF, and China International Industry Fair offer extensive networking opportunities.
  • India: India International Trade Fair, Auto Expo, and Vibrant Gujarat Global Trade Show are prominent events.
  • Vietnam: VIETNAM EXPO, VIFA-EXPO, and Vietnam Foodexpo showcase diverse products and suppliers.
  • Indonesia: Trade Expo Indonesia and IndoBuildTech Expo focus on industry and construction.


Drawbacks: Attending trade fairs is costly and time-consuming, and assessing a supplier’s capabilities beyond the event requires additional research.

What are the benefits of using sourcing agents?

Working with local sourcing agents or specialized sourcing companies is an effective strategy to navigate the complexities of international sourcing, especially in unfamiliar markets. These professionals offer invaluable local expertise, possess established networks, and can handle the extensive legwork involved in identifying, vetting, and managing suppliers on your behalf, saving you time and mitigating risks.

What Sourcing Agents Offer:

  • Supplier Identification: Sourcing agents have in-depth knowledge of local markets and can identify trustworthy suppliers that meet the buyer’s specific requirements (e.g., pricing, capacity, certifications).
  • Quality Control and Inspections: Sourcing agents often visit supplier facilities to conduct quality checks and ensure compliance with international standards before products are shipped. This helps avoid costly mistakes, especially in industries like electronics, textiles, and machinery.
  • Negotiations: Local agents understand the cultural nuances and business practices of their region. They can negotiate better pricing, payment terms, and delivery schedules on your behalf, ensuring a fair deal.
  • Logistics and Shipping Coordination: Sourcing agents often handle the logistics side, coordinating with freight forwarders, shipping companies, and customs authorities to ensure that goods are delivered efficiently and on time.

VnCommEx offers comprehensive support to international businesses looking to source from Vietnam, guiding you every step of the way.

How can trade promotion agencies help find global suppliers?

Trade promotion agencies are government or quasi-government organizations designed to help businesses expand internationally. While their primary role is often to promote exports from their home country, they also play a crucial role in facilitating business matchmaking and supplier discovery for international buyers. These agencies can provide valuable resources and connections to help you find reliable global suppliers. Here are key agencies to consider:

  • U.S. Commercial Service: The U.S. Commercial Service can help businesses identify suppliers or partners in foreign markets through services like the International Partner Search (IPS), where they provide a list of pre-screened companies that meet your criteria.
  • UK Trade & Investment (UKTI): UKTI is the British government’s department responsible for promoting British exports and attracting foreign investment into the UK. It helps businesses identify potential suppliers, partners, and clients in global markets. They also offer export documentation and market entry advice.
  • Japan External Trade Organization (JETRO): JETRO is a Japanese government organization that promotes trade and investment. It supports foreign companies in finding Japanese suppliers and offers comprehensive business matching programs.
  • Enterprise Europe Network (EEN): A European Commission initiative that helps small and medium-sized enterprises (SMEs) find international partners, including suppliers. EEN operates in over 60 countries and provides free business matchmaking services through an extensive network of industry experts.

Can Chambers of Commerce help connect with global suppliers?

Yes, Chambers of Commerce, encompassing both bilateral and local organizations, play a significant role in connecting businesses with potential suppliers. These organizations often maintain extensive databases of local and international suppliers and regularly organize networking events, trade missions, and business matchmaking sessions to facilitate introductions and foster new partnerships.

  • Bilateral Chambers: Facilitate trade between two countries, like AmCham Vietnam and the Germany-Vietnam Chamber of Commerce.
  • Local Chambers: Offer supplier networks within a specific region, such as the Vietnam Chamber of Commerce and Industry (VCCI).

Why are industry networks useful for finding global suppliers?

Leveraging industry-specific networks is an exceptionally effective way to find reputable global suppliers and build strong, lasting business relationships. These networks offer tailored support, provide deep industry-specific insights, and grant access to vetted suppliers through established communities of professionals. By connecting with peers and experts in your sector, you can gain valuable recommendations and stay informed about reliable sourcing options.

Industry-specific networks focus on particular sectors like technology, construction, or agriculture. These networks often provide supplier matchmaking services and organize events where you can meet potential partners. Participating in industry-specific groups helps you stay updated on market trends, new supplier innovations, and changes in sourcing practices. It’s also a good platform to get supplier recommendations from peers.

What are the main challenges and solutions in global sourcing?

Global sourcing, while offering immense opportunities, inherently comes with a unique set of regulatory and cultural challenges. Despite efforts by international organizations to standardize practices, significant discrepancies often remain across different countries. Special government regulations, non-tariff barriers, and varying compliance requirements can add considerable complexity to the sourcing process. Furthermore, language barriers and cultural differences can significantly impact effective communication and relationship building with suppliers, particularly in developing countries.

To mitigate these challenges, businesses should initially work with intermediary partners to gain insights and navigate complexities. As familiarity with the market grows, establishing direct operations or long-term partnerships can help reduce costs and streamline global supply chain integration.

At VnCommEx, we specialize in helping international businesses navigate the complexities of sourcing from Vietnam. From supplier identification to logistics coordination, we’re here to ensure your success in the global marketplace.

Understand more about the sourcing situation:

  • Global Sourcing: Trends Shaping the Future
  • Overview Top Sourcing Countries In The World
  • Sourcing from China, Vietnam, India, and Bangladesh: Pros and Cons
September 7, 2024 0 comment
0 FacebookTwitterLinkedinWhatsapp
Logistic organisation on a warehouse
Market Insights

Global Sourcing: Trends Shaping the Future

by Henry Truong September 3, 2024
written by Henry Truong

Global sourcing is becoming an essential strategy for companies in developed countries. Amidst increasing economic and political volatility, as well as growing ESG pressures, importers must consider more factors beyond just price. Supply chains need to be environmentally friendly and low in carbon, while still maintaining a stable flow of goods. Although this presents many challenges, it also creates opportunities for the global supply chain industry to develop new trends in the near future.

So, which trends will shape the future development of the global supply chain? Let’s explore the leading trends in this article with VnCommEx.

Why is diversifying suppliers across multiple countries important for global sourcing?

Diversifying suppliers across multiple countries has become crucial for global sourcing due to an increasingly unstable geopolitical environment, marked by conflicts like those in the Middle East and between Russia and Ukraine. These instabilities have led to altered shipping routes, such as the closure of transportation through the Red Sea due to political unrest in Yemen, creating uncertainty for the next 3-5 years and highlighting the need for businesses to mitigate risks beyond single-country dependencies.

In the past, most major global corporations followed a strategy of setting up factories in countries with low labour costs, tax incentives, and optimized logistics. Now, they must also consider diversifying their supply sources to avoid issues related to geopolitical conflicts. According to a 2023 global survey by KPMG, 77% of CEOs from leading global corporations agreed that the risk of supply chain disruptions is highly likely to occur in the next five years, which could seriously impact market supply if contingency plans are not in place.

The “China +1” strategy is being considered and gradually implemented. Under this strategy, global companies are proactively shifting part of their goods and production to countries outside of China. The most common destinations are India and several Southeast Asian countries such as Vietnam, Thailand, Indonesia, as well as Mexico and Poland.

Since the “China +1” strategy has been adopted by major companies, Vietnam has seen a significant increase in foreign investment. In 2023 alone, the total registered foreign direct investment (FDI) in Vietnam reached nearly USD 36.61 billion, up 32.1% compared to the same period last year. The top investing countries in Vietnam include South Korea, Singapore, and China. South Korea leads with USD 1.1 billion in investment, followed by Singapore with USD 639 million, and China with USD 382 million.

Compare the top of sourcing country in the world: Sourcing from China, Vietnam, India, and Bangladesh: Pros and Cons

How do Generative AI and other technologies impact global sourcing?

Generative AI, alongside predictive analytics models and robotic process automation (RPA), is set to revolutionize global sourcing and procurement by streamlining complex tasks and reducing both time and labor costs. These technologies leverage AI’s ability to process vast amounts of data quickly and accurately, helping importers and procurement teams make more efficient and informed decisions. Key applications of Generative AI technology include:

Generative AI in Procurement

Generative AI is particularly transformative in its ability to analyze data from diverse sources, including internal business databases and external market data. This capability allows procurement teams to make more informed decisions, predicting trends, market demand, and customer behaviour with unprecedented precision. For example, by leveraging AI-driven predictive analytics, companies can optimize their inventory management, reducing waste and enhancing operational efficiency.

Furthermore, generative AI extends beyond data analysis—it can create new content such as text, images, audio, and even code. This makes it a powerful tool not only for content creation but also for product design and software development. In the near future, generative AI could enable businesses to develop new products faster and deliver personalized customer experiences on a scale that was previously unimaginable.

Robotic Process Automation (RPA) in Sourcing

RPA is another critical technology that will continue to expand in the realm of business processes. RPA tools automate repetitive and routine tasks such as order processing, data management, and financial transactions. As these tools become more sophisticated, they will integrate more closely with AI, enabling them to make decisions based on complex data and contextual information, not just perform pre-programmed tasks.

Case Study – L’Oréal Cosmetics:

L’Oréal Cosmetics serves as a prime example of how AI can optimize global sourcing. The company uses AI models to analyze data on the quality and pricing of raw materials from multiple countries. This allows them to select the best suppliers and manage their global supply chain more effectively. By using AI to streamline these processes, L’Oréal reduces risks associated with supply chain disruptions and enhances sustainability across their operations.

In summary, technologies like generative AI, predictive analytics, and RPA are not just trends but fundamental shifts that will shape the future of global sourcing. These tools provide procurement teams with the ability to operate more efficiently, make smarter decisions, and ultimately, drive innovation in how products are designed, produced, and delivered.

What are ESG standards and why are they important for global sourcing?

ESG (Environmental, Social, and Governance) standards are rapidly expanding regulations, particularly led by the EU, with other major economies like the United States, Canada, Japan, and China also developing their own. These standards are crucial for global sourcing because they represent a global trend toward mandatory compliance, directly influencing the long-term growth of companies and their sourcing strategies. A KPMG survey indicates that 66% of respondents believe ESG requirements will significantly impact sourcing strategies in the next 3-5 years, making prioritization essential for both importers and suppliers.

The environmental protection movement began in the 1970s, and regulations are becoming increasingly stringent. Transitioning to a circular business model involves more than just recycling and using green energy; it requires transforming the entire organization, from product design and production processes to distribution and reuse.

In recent years, suppliers have been conducting rigorous ESG assessments of their partners, demanding sustainably sourced materials and adherence to international certifications such as ISO 14001 or SA8000 to affirm their commitment to sustainable development. Failure to comply with ESG standards can result in severe penalties, including bans on importing goods into major markets like the United States, EU, and China.

Compliance with ESG standards is not just a competitive advantage but an essential requirement to ensure sustainable growth and long-term success in an increasingly complex global business environment.

How can blockchain and cryptocurrency improve global supply chains?

Blockchain and cryptocurrency offer significant potential to improve global supply chains by enabling “trustless” transactions and reducing operational costs. Over the past decade, the global supply chain has increasingly explored these technologies, which create an economic system operating without human intervention. This viable alternative eliminates intermediaries, thereby increasing service efficiency and streamlining various processes within the supply chain.

Applications of blockchain in supply chain management include:

  • Enhancing Transparency in the Supply Chain: Since data on the blockchain cannot be altered without the consensus of the entire network, this technology helps minimize the risks of fraud and counterfeiting in the supply chain. Every step in the production and transportation process is recorded on a decentralized ledger, allowing stakeholders to track products from raw materials to finished goods. For example, in the food industry, blockchain is used to trace the journey of products from farm to table, ensuring transparency and safety for consumers.
  • Improving Liquidity and Payment Efficiency: The digitization of currency and payment channels can be an effective solution to address issues related to 30-60-90-day payment terms and bad debt in supply chain finance. Additionally, this promotes a “just-in-time” economy for currency. Digital currency helps companies in the supply chain maintain better liquidity, enabling the implementation of smart contracts that automatically execute when predefined conditions are met. For instance, when a shipment arrives at its delivery location, automatic payment can be triggered without manual intervention, saving time and reducing the risk of errors.

Currently, the letter of credit (LC) remains one of the most popular international payment methods due to its safety. In the future, blockchain has the potential to replace this method with its inherent advantages.

What are the applications of VR/AR in global supply chains?

Virtual and Augmented Reality (VR/AR) applications are significantly impacting global supply chains, driven by advancements in high-quality, low-cost mobile electronic devices and improved system synchronization. According to a Deloitte report, VR alone has the potential to revolutionize supply chains in four key areas: product and process design, data and process visualization, employee collaboration, and training processes. These applications help companies improve efficiency, reduce errors, and optimize production processes, with specific uses including:

  • AR Applications in Warehouse Management and Logistics: Augmented Reality (AR) can be integrated with GPS tracking systems and IoT to provide real-time information on the location of goods during transport. Warehouse staff or logistics managers can use AR glasses to display routes, shipment status, and delivery time predictions right in front of them. This helps manage the flow of goods more efficiently, ensuring accuracy and timeliness in the supply chain.

Logistic organisation on a warehouse

  • VR Applications in Remote Management and Inspection: Executives and senior managers can use VR to participate in meetings or inspect factory operations remotely, maintaining control and making quick decisions without needing to be physically present on-site. This is particularly useful in the context of globalization and travel challenges.
  • AR in Inventory and Production Management: For supply companies, AR supports inventory management and production oversight. Employees can use AR glasses to scan barcodes or QR codes, receiving detailed information about products such as quantity, location, and inventory status. This not only reduces errors but also speeds up the inventory process, enhancing operational efficiency.
  • Creating Interactive Customer Experiences: VR and AR create interactive experiences for customers at trade shows. Customers can connect remotely, and observe products and production processes. With VR, they can navigate virtual booths, interact with 3D models, and participate in live discussions. AR provides detailed product information and allows for interactive activities such as production process simulations, product trials, or participation in product-related games.

These applications not only enhance operational efficiency but also create new and engaging experiences for customers, helping businesses increase interaction and improve brand image.

Conclusion

The coming years are expected to be highly volatile, shaped by the lingering effects of the COVID-19 pandemic, ongoing geopolitical conflicts, and the introduction of new regulations worldwide. However, these challenges present a unique opportunity for leaders in global import and supply companies to rethink and reshape their strategies.

Harnessing the power of big data, enhanced by generative AI, will be crucial for companies looking to promote sustainable procurement, achieve high performance, and drive breakthrough growth. By staying ahead of the curve, businesses can navigate uncertainties more effectively and capitalize on emerging opportunities.

At the same time, importers must consider diversifying production to markets with less geopolitical risk, ample raw materials, and lower labor costs to secure a stable supply chain. Southeast Asian countries, stand out as ideal locations. This strategic approach is already being adopted by major corporations such as Samsung, Apple, and Lego, who are leading the way in global sourcing and production diversification.

This dual approach—leveraging advanced technologies and strategically expanding production—will be key to thriving in an increasingly complex global market.

Understand more about the soucring situation:

  • Overview Top Sourcing Countries In The World
  • Best Practices for Sourcing a Global Supplier Network
September 3, 2024 0 comment
0 FacebookTwitterLinkedinWhatsapp
Vietnam agriculture products
Market Insights

What products should you be sourcing from Vietnam?

by Henry Truong August 27, 2024
written by Henry Truong

Why should you source textile products from Vietnam?

Sourcing textile products from Vietnam offers significant advantages due to the industry’s international recognition for high quality and precision. Vietnamese textile products, ranging from fashion apparel to specialty fabrics, are highly regarded for their durability, diverse designs, and strict adherence to international standards. This reputation is built on a combination of modern technology and skilled craftsmanship, resulting in beautiful and high-quality outputs. Furthermore, many textile factories in Vietnam hold international certifications for quality management, environmental protection, and social responsibility, ensuring reliable and ethically produced goods for global importers.

In 2023, textile export revenue reached $40.3 billion, making Vietnam one of the top three textile-exporting countries in the world. Vietnamese textile products are exported to more than 180 countries, with the main markets being the United States, the EU, Japan, and South Korea. The United States accounts for 50% of the total export value, followed by the EU with 18%. Vietnam is also expanding its market to ASEAN and emerging markets such as Australia, Canada, and the Middle East. These achievements not only confirm Vietnam’s production capacity but also enhance the position of its textile industry in the international market, making it a reliable source of supply for global partners.

Maybe you will like: Sourcing Textile & Garment Products from Vietnam: A Complete Guide

Total export turnover of garment industry 2022 – 2023

Export value of textile industry

Export value of textile industry

What makes Vietnam a top choice for footwear sourcing?

Vietnam stands out as a top choice for footwear sourcing primarily due to its combination of low production costs, competitive pricing, and consistently high quality. This has propelled Vietnam to the second position globally in footwear exports, capturing 10% of the worldwide market share. Footwear proudly bearing the “Made in Vietnam” label reaches 150 markets, with major destinations including the United States, the EU, China, Japan, and South Korea, which collectively represent 80% of the total export value. Notably, in 2023, the United States imported over $7.1 billion worth of footwear from Vietnam, and by the first quarter of 2024, Vietnamese footwear already accounted for 45% of the U.S. market share, underscoring its strong global presence and reliability.

Vietnam footwear export quater 1 2024

Vietnam footwear export quater 1 2024

Overview of Vietnam’s export value of What makes Vietnam a top choice for footwear sourcing?

Currently, more than 10% of the world’s population wears shoes produced in Vietnam, especially fabric shoes, where Vietnam leads the world in production value. Vietnam’s footwear industry stands out with its diversity in types and designs, catering to all market segments from budget to high-end. The factories not only manufacture for major brands like Nike, Adidas, and Puma but also develop unique product lines tailored to market needs. The diversity in materials, from genuine leather and woven fabrics to environmentally friendly synthetic materials, along with creative design and customization capabilities, has helped Vietnam’s footwear industry meet global market demands effectively.

Why is Vietnam a leading source for furniture and home decor?

Vietnam has emerged as a leading source for furniture and home decor, solidifying its position as one of the top five wood-exporting countries globally. This strong market presence is evident in key international markets; for instance, in the first quarter of 2024, wood furniture from Vietnam constituted 40.8% of the total import value in the United States, amounting to $2.7 billion. Furthermore, strategic tariff reduction commitments under agreements like the CPTPP have enabled Vietnam to significantly expand its market share in other major markets, including Canada (14.8%) and Japan (22%), making it an increasingly attractive option for global importers.

Currently, Vietnam has about 6,000 wood processing and manufacturing enterprises with over 420,000 skilled workers employed in factories, with 55-60% of the workforce being trained and stable. The total demand for raw wood for the wood processing industry in Vietnam is 40 million m³ per year, with sources from concentrated plantations (20.5 million m³), scattered trees, and rubber wood (9.6 million m³), and imported wood (8.5 million m³). All wood sources have legal timber certificates, ensuring traceability according to legal regulations.

Vietnam has also effectively implemented related conventions and agreements, such as CITES, UNCCD, and VPA/FLEGT. As of 2023, Vietnam’s natural and planted forest areas are 10.3 million ha and 4.3 million ha, respectively, with 70% of the forest area being natural and 30% being planted forests. The government is focusing on providing the best wood varieties. 

Understand more about the Vietnam’s Timber industry here

What agricultural products can you source from Vietnam?

Vietnam’s agricultural sector offers a diverse range of products for sourcing, including globally recognized items like coffee, cashews, and pepper, alongside popular tropical fruits such as mango, dragon fruit, and bananas. Benefiting from favorable natural conditions and sustainable farming practices, Vietnam has become the world’s second-largest coffee exporter and the leading global exporter of cashews. These agricultural products are not only diverse but also highly valued for their quality, consistently meeting international standards. Furthermore, Vietnamese agricultural products are competitively priced in the global market due to low production costs and supportive government policies, enabling importers to optimize costs and enhance their competitiveness while ensuring superior quality.

See more about Durian, Dragon Fruit, Mango: Driving Vietnam’s Export Success

Vietnam agriculture products

Vietnam agriculture products

Currently, Vietnam has over 10 groups of products with export values exceeding $1 billion, including fruits, rice, coffee, cashews, pepper, and wood products. Vietnamese agricultural products are now present in 200 countries worldwide, becoming familiar names in demanding markets such as the U.S., EU, and Japan through FTAs and EVFTA agreements.

Why is Vietnam a growing hub for electronics and electrical product sourcing?

Vietnam is rapidly becoming a growing hub for electronics and electrical product sourcing, evidenced by its strong presence in major international markets like the United States, China, and the EU. The continuous growth in export value from Vietnam’s electronics and components industry underscores its vast potential for meeting the diverse demands of global markets. This sector’s expansion is driven by significant investments from leading global technology companies and a strategic focus on enhancing domestic production capacity, making it an increasingly attractive option for international importers.

With significant investment from leading global technology companies like Samsung, Apple, and Intel, the computer, electronic products, and components sectors, along with electrical products and other components, are consistently among Vietnam’s top export groups, maintaining a quarterly scale of $14-16 billion. Although much of the current growth comes from FDI enterprises, the potential for the domestic electronics sector is still vast. Vietnam is focusing on enhancing domestic production capacity, encouraging local businesses to invest in new technologies and improving product quality. This creates significant opportunities for companies looking to tap into this promising market.

Thanks to low labour costs and government support, electronics and components produced in Vietnam are very competitively priced. This allows importers to optimize costs while ensuring product quality, thereby increasing competitiveness in the global market.

Overview Vietnam Phones & Accessories Export Value 2011 – 2023

Vietnam Why is Vietnam a growing hub for electronics and electrical product sourcing?

What opportunities does Vietnam offer for sourcing technology and software products?

Vietnam offers significant opportunities for sourcing technology and software products, driven by a booming industry characterized by innovative startups in areas like fintech, e-commerce, AI, and blockchain. These startups are not only addressing domestic needs but are also successfully expanding into international markets, developing cutting-edge products and services such as mobile payment applications and e-commerce platforms. The Vietnamese government actively supports this growth through policies like a high-tech development program extending to 2030 and tax incentives for new businesses. Furthermore, the presence of startup incubators and venture capital funds fosters rapid and sustainable development within the tech sector. A key advantage for foreign companies sourcing from Vietnam is the significantly lower human resource costs compared to global averages, without compromising on quality, making it an attractive destination for technology and software development.

Conclusion

With a rapidly growing economy, skilled workforce, and strategic geographic location, Vietnam is solidifying its position as a leading global sourcing destination. From textiles and footwear to wood products, agricultural goods, and high-tech products, Vietnam offers great opportunities for international businesses. Significant progress in infrastructure development, government support policies, and adherence to international standards have created a favourable and reliable business environment. Sourcing from Vietnam not only helps companies optimize costs but also ensures product quality, contributing to success and sustainable growth in an increasingly competitive global landscape.

See more related articles:

  • Overview Top Sourcing Countries In The World
  • Best Practices for Sourcing a Global Supplier Network
August 27, 2024 0 comment
0 FacebookTwitterLinkedinWhatsapp
Newer Posts
Older Posts

Recent Posts

  • Import Vietnamese Coffee: Your Strategic B2B Playbook
  • Vietnam’s Coffee Economy: Market Trends, Export, and Sustainable Future
  • Vietnamese Coffee Brands: Your Definitive Guide to Authentic Flavors, Top Picks & Smart Buying
  • Vietnamese Coffee Taste: Your Sensory Guide to Bold Flavors
  • Vietnamese Coffee: Ultimate Guide to History, Brews & Global Impact

Follow Us

Facebook Linkedin Twitter

Recent Posts

  • Import Vietnamese Coffee: Your Strategic B2B Playbook

    December 17, 2025
  • Vietnam’s Coffee Economy: Market Trends, Export, and Sustainable Future

    December 15, 2025
  • Vietnamese Coffee Brands: Your Definitive Guide to Authentic Flavors, Top Picks & Smart Buying

    December 13, 2025
  • Vietnamese Coffee Taste: Your Sensory Guide to Bold Flavors

    December 12, 2025
  • Vietnamese Coffee: Ultimate Guide to History, Brews & Global Impact

    December 11, 2025

Categories

  • Food & Spicy Industry (30)
  • Free Trade Agreement (18)
  • Fruit & Vegetable (56)
  • Garment & Footwear (11)
  • Market Insights (29)
  • Others (4)
  • Seafood (4)
  • Vietnam Commodity Market Price (17)
  • Vietnam Export Data (15)
  • Vietnam Market (6)
  • Wood & Furniture (19)

Vietnam Commodity Export offers comprehensive and in-depth information on Vietnam’s sourcing market, highlighting opportunities and challenges across various industries. We help international businesses find quality manufacturers and reliable suppliers in Vietnam, providing the critical insights needed to connect with the best partners and resources in the market.

Newsletter Subscribe
    • Homepage
    • Market Insight
    • Sourcing Service
    • Vietnam Overview
    • Publication
    • About Us
    • Contact Us
  • Product Catalogue
    • Coconut Products
    • Tropical Fruits
    • Spicy Products
    • Food & Nuts Products
    • Dried Fruit

You are looking for suppliers in Vietnam!

Shop Now
Facebook Linkedin Twitter Email
VNCOMMEX Group Co. Ltd Address: 06 Vo Van Kiet, Nguyen Thai Binh Ward, District 1, HCMC
Email: info@vncommex.com

All rights reserved. Designed and developed by Vietnam Commodity Exports

Privacy Policy

FAQ

VnCommEx
  • VCE
  • Product Catalogue
  • Market Insight
    • Wood & Furniture
    • Garment & Footwear
    • Food & Spicy Industry
    • Fruit & Vegetable
    • Others
    • Market Insights
  • Vietnam Market
    • Vietnam Commodity Market Price
    • Vietnam Export Data
    • Vietnam in FTA
  • Publication
  • About Us
  • English
    • 中文 (中国)
    • Tiếng Việt
VnCommEx
  • VCE
  • Product Catalogue
  • Market Insight
    • Wood & Furniture
    • Garment & Footwear
    • Food & Spicy Industry
    • Fruit & Vegetable
    • Others
    • Market Insights
  • Vietnam Market
    • Vietnam Commodity Market Price
    • Vietnam Export Data
    • Vietnam in FTA
  • Publication
  • About Us
  • English
    • 中文 (中国)
    • Tiếng Việt
@2021 - All Right Reserved. Designed and Developed by PenciDesign
✕

Shopping Cart

Close
No products in the cart.
Close
 
Return to shop