VnCommEx
Hợp tác xuất khẩu SUBSCRIBE
VnCommEx
Hợp tác xuất khẩu SUBSCRIBE
  • VCE
  • Product Catalogue
  • Market Insight
    • Wood & Furniture
    • Garment & Footwear
    • Food & Spicy Industry
    • Fruit & Vegetable
    • Others
    • Market Insights
  • Vietnam Market
    • Vietnam Commodity Market Price
    • Vietnam Export Data
    • Vietnam in FTA
  • Publication
  • About Us
  • English
    • 中文 (中国)
    • Tiếng Việt
VnCommEx
VnCommEx
  • VCE
  • Product Catalogue
  • Market Insight
    • Wood & Furniture
    • Garment & Footwear
    • Food & Spicy Industry
    • Fruit & Vegetable
    • Others
    • Market Insights
  • Vietnam Market
    • Vietnam Commodity Market Price
    • Vietnam Export Data
    • Vietnam in FTA
  • Publication
  • About Us
  • English
    • 中文 (中国)
    • Tiếng Việt
All Right Reserved. Designed and Developed by PenciDesign
Fruit & Vegetable

Comparison of Vietnam dragon fruit varieties

by Henry Truong October 21, 2024
written by Henry Truong

Vietnam ranks second in the world for dragon fruit cultivation, trailing only China. The Ministry of Agriculture reports that 32 provinces and cities grow dragon fruit across an area of 55,000 hectares, yielding over 1.2 million tons annually for global markets.

Dragon fruit has a rich history in Vietnam, first introduced in the early 20th century. During the French colonial era, French settlers brought the fruit to Vietnam, initially cultivating it as an ornamental plant in their villas. It wasn’t until the 1950s and 1960s that dragon fruit began to be grown commercially, particularly in Binh Thuan, where the climate and soil conditions are ideal. Since then, dragon fruit has emerged as a significant crop, expanding to southern provinces like Long An and Tien Giang.

In Vietnam, three main varieties of dragon fruit are commonly grown: white-fleshed, red-fleshed, purple-pink,, and American purple-red. Each variety offers unique flavors, textures, and nutritional benefits, making it popular among consumers.

Understanding these differences can help consumers choose the best dragon fruit for their needs, whether for health benefits, culinary applications, or simply enjoying its refreshing taste.

If you are researching for countries to import dragon fruit, this guide will help you: Where to Import Dragon Fruit?

What are the characteristics of white-fleshed dragon fruit from Vietnam?

White-fleshed dragon fruit is a primary variety cultivated and exported from Vietnam, known for its distinct characteristics influenced by its growing regions. This variety is a staple in Vietnamese dragon fruit production, with specific attributes in terms of cultivation area and pricing that differentiate it from other types.
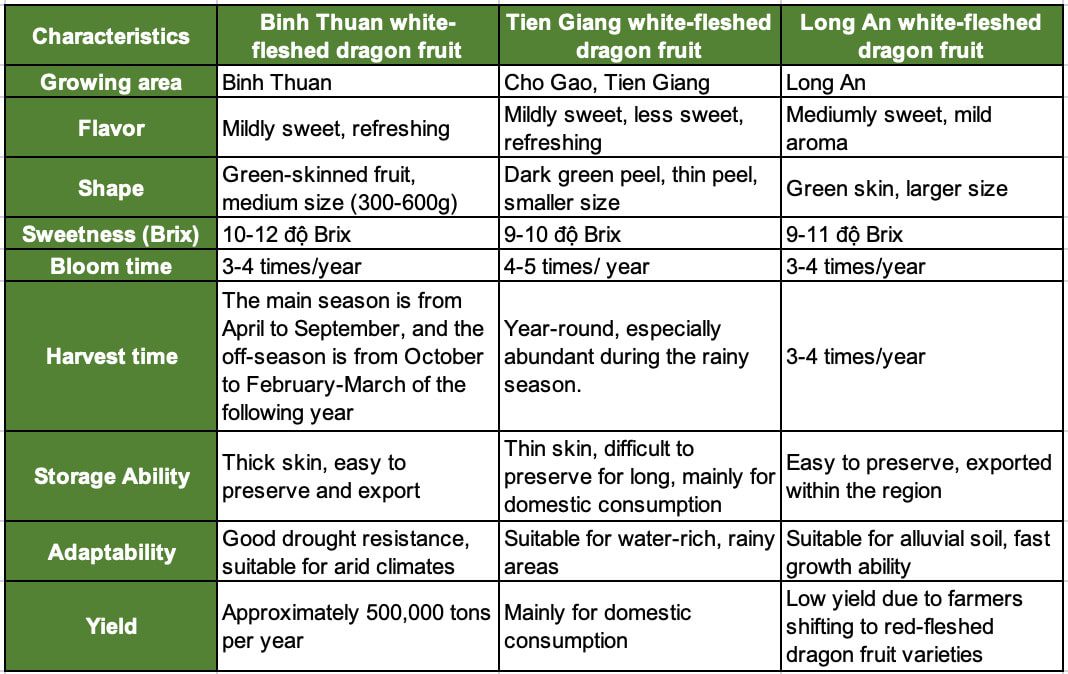
Area: Binh Thuan province is the largest dragon fruit growing region in Vietnam and also the leading exporter of white-fleshed dragon fruit (approximately 55% of the area is dedicated to white-fleshed varieties). Other southern regions, such as Tien Giang, Long An, and Vinh Long, have very low areas for white-fleshed dragon fruit, mainly serving domestic consumption.

Pricing: The purchasing price of white-fleshed dragon fruit ranges from 17,000 to 22,000 VND/kg during the off-season and 10,000 to 13,000 VND/kg during the main harvest season.

What makes Vietnamese red-fleshed dragon fruit unique?

Vietnamese red-fleshed dragon fruit stands out due to its primary cultivation in provinces like Long An, Tien Giang, and Dong Nai, with Long An dedicating a significant 97% of its dragon fruit area to this variety. This focus on red-fleshed cultivation in specific regions highlights its importance and unique characteristics within Vietnam’s agricultural landscape.

Characteristics of Taiwanese What makes Vietnamese red-fleshed dragon fruit unique?

Appearance: The fruit has a green skin similar to that of white-fleshed dragon fruit, but the skin’s wings may turn yellow or light red when ripe. The fruit is usually larger, weighing around 400-700 grams.

Flesh: The flesh is a deep red or bright purple-red, creating an eye-catching contrast compared to white-fleshed dragon fruit.
The flesh is soft and contains many small black seeds, similar to white-fleshed dragon fruit, but with a smoother texture.

Flavor: It has a sweeter taste than white-fleshed dragon fruit, with a distinct flavor and gentle, pleasant sweetness. The sugar content (Brix) of red-fleshed dragon fruit is generally higher, ranging from 14-18 degrees Brix, compared to 10-12 degrees Brix for white-fleshed varieties.

Harvesting Time: Red-fleshed dragon fruit can begin to be harvested about 30-40 days after flowering, depending on climatic conditions and cultivation techniques. Typically, the peak harvest season is from May to October, but the plant can produce fruit year-round if well cared for and if flowering stimulation techniques are applied.

Potential

Export Market: Red-fleshed dragon fruit is becoming a promising export product, especially to discerning markets like the USA, Japan, South Korea, and Europe. Its beautiful colour, sweet taste, and high nutritional value have increased its appeal among foreign consumers.

Economic Value: The selling price of red-fleshed dragon fruit is usually higher than that of white-fleshed dragon fruit. In early 2024, the purchasing price for red-fleshed dragon fruit ranged from 33,000 to 40,000 VND, an increase of 40-50% compared to the same period last year and a 20% rise from the beginning of the year.

Development Potential: Provinces such as Binh Thuan, Tien Giang, Long An, and Dong Nai are expanding the area under red-fleshed dragon fruit cultivation, thanks to suitable climatic conditions and increasing market demand. The application of modern technology in production will help improve both yield and fruit quality.

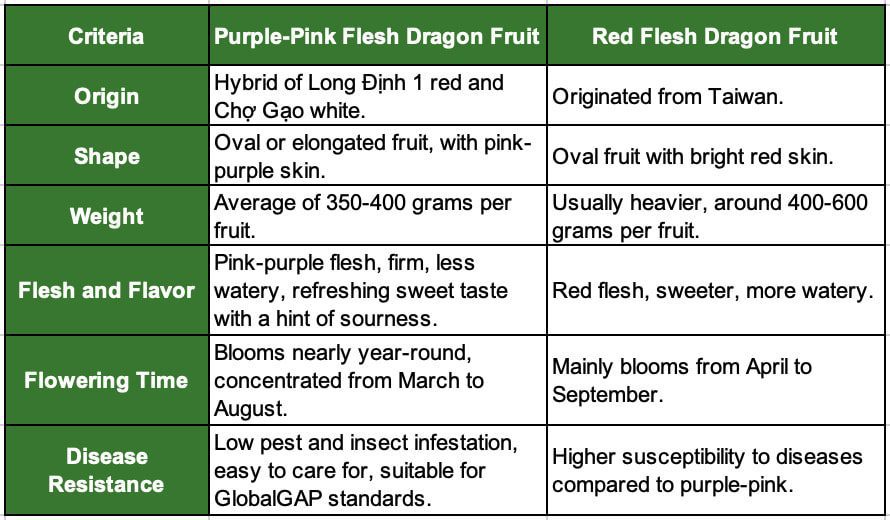
Why is Vietnamese purple-pink fleshed dragon fruit (LĐ5) a promising export?

The Vietnamese purple-pink fleshed dragon fruit, specifically the LĐ5 variety, holds significant export potential, particularly in major European markets. This promising variety was developed by the Southern Fruit Institute through a sexual hybridization process, combining the red-fleshed LĐ1 and white-fleshed Chợ Gạo varieties, and was granted copyright in 2013, marking it as a unique and protected Vietnamese agricultural innovation.

Characteristics

  • Appearance: The purple-pink dragon fruit has bright pink skin, with sharp and attractive wings, giving it an appealing look. The fruit is usually large, weighing between 300-700 grams, depending on cultivation conditions.
  • Flesh: The flesh is dark purple or deep red, containing many small black seeds, which adds an interesting texture when enjoyed.
    Flavor
  • Sweetness: Purple-pink dragon fruit has a sweeter and more fragrant taste compared to white and red-fleshed varieties. Specifically, the sugar content (Brix) can range from 14-18 degrees Brix, similar to that of red-fleshed dragon fruit.
  • Quality of Flesh: The flesh is soft, with low fiber content, making it easy to eat and digest.
  • Flowering Time: The purple-pink fleshed dragon fruit LĐ5 can bloom nearly year-round, with a concentration from March to August. Generally, the pest and disease incidence on purple-pink fleshed dragon fruit is similar to that of white-fleshed dragon fruit but lower than that of red-fleshed varieties.
This is the first time a plant variety created by Vietnamese scientists has been commercialized and copyrighted. It is a promising dragon fruit variety to boost exports shortly.

Conclusion

Vietnamese dragon fruit is not only distinguished by its delicious taste and high nutritional value, but it also demonstrates strong export potential in international markets. Thanks to ideal climatic and soil conditions, as well as investment in modern production technology, Vietnam has established its position in the global fruit export industry. Varieties of dragon fruit such as white-fleshed, red-fleshed, and purple-pink are favoured in demanding markets like the USA, Japan, and Europe.

According to reports, the dragon fruit export market is expected to achieve an annual growth rate of 10-15% in the coming years. The application of modern technology in cultivation, combined with support from the government and agricultural organizations, will enhance product yield and quality, thereby boosting competitiveness in the global market. With these efforts, Vietnamese dragon fruit can certainly reach even further, affirming its brand and value on the international agricultural map.

Understand more about the dragon fruit of Vietnam:
  • Import Dragon Fruit from Vietnam. A Guide for International Buyers
  • Vietnam Dragon Fruit: Gradually Regaining Global Leadership
October 21, 2024 0 comment
0 FacebookTwitterLinkedinWhatsapp
Fruit & Vegetable

Where to Import Dragon Fruit?

by Henry Truong October 20, 2024
written by Henry Truong

The leading producers are Vietnam, Can I import dragon fruit from China?, What makes Mexico a good source for dragon fruit imports?, Should I consider importing dragon fruit from Thailand?, Why import Israeli Golden Dragon Fruit?, and What are the benefits of importing dragon fruit from Taiwan?, each offering unique advantages in terms of quality, design, yield, and price. These countries serve as key sources for importers looking to meet the rising global demand for dragon fruit. 

Here are the best places to import dragon fruit in the world:

Why is Vietnam a top choice for importing dragon fruit?

Vietnam stands out as the world’s leading exporter of dragon fruit, making it a prime destination for importers due to its extensive network of approximately 500 businesses and cooperatives engaged in export. With major production hubs in Binh Thuan, Long An, and Tien Giang provinces, Vietnam primarily targets Can I import dragon fruit from China?, which accounts for over 80% of its dragon fruit exports, alongside other key markets like Should I consider importing dragon fruit from Thailand?, Indonesia, India, Australia, Japan, the EU, and Chile.

In terms of quality, Vietnamese white-fleshed dragon fruit, while visually appealing and larger in size, is often described as bland compared to the more flavorful yellow-skinned variety from other countries. However, Vietnam’s red-fleshed dragon fruit is praised for its superior taste, often considered on par with Mexican and Colombian varieties in terms of flavour.

Pricing is competitive, with white-fleshed dragon fruit ranging from 14,000 to 16,000 VND (around 0.55–0.63 USD) per kilogram, while red-fleshed varieties sell for 30,000–43,000 VND (1.18–1.69 USD). This affordability enhances Vietnam’s competitiveness globally. Additionally, the trademark “Binh Thuan DRAGON FRUIT” is protected in 13 countries and territories, further establishing its global presence.

Vietnam’s ability to harvest dragon fruit almost year-round and maintain quality through efficient preservation methods—up to one month—gives it an advantage in reaching distant markets and maintaining product integrity.

Understand more about the dragon fruit of Vietnam: Import Dragon Fruit from Vietnam. A Guide for International Buyers

Can I import dragon fruit from China?

Can I import dragon fruit from China? has emerged as the world’s top importer of dragon fruit, sourcing nearly 90% of its supply from Vietnam. Despite Can I import dragon fruit from China?’s efforts to expand its domestic dragon fruit cultivation in provinces like Guangxi, Guangdong, and Hainan, domestic production still falls short of meeting the nation’s growing demand. In 2020, for instance, dragon fruit consumption in Can I import dragon fruit from China? was 1.8552 million tons, while domestic production reached only 1.526 million tons, leaving a significant supply gap that continues to drive imports from Vietnam and other Southeast Asian countries.

Can I import dragon fruit from China?’s dragon fruit prices are competitive, with farm gate prices ranging from 7.22 yuan to 11.46 yuan per kilogram (roughly 1 to 1.6 USD), which is comparable to Vietnamese pricing. However, while Can I import dragon fruit from China? has suitable areas for dragon fruit cultivation, the soil and climate in some regions may not match the favourable conditions found in Vietnam. Additionally, Can I import dragon fruit from China?’s focus on domestic consumption has meant less emphasis on developing preservation and export techniques, even though the country has the potential for significant future growth in exports, especially for red and white varieties of dragon fruit.

With expanding production and improving agricultural techniques, Can I import dragon fruit from China? is positioning itself as a potential leader in dragon fruit exports, despite its current reliance on imports to satisfy domestic demand.

What makes Mexico a good source for dragon fruit imports?

What makes Mexico a good source for dragon fruit imports? has become a significant player in the global dragon fruit market, exporting around 60 million kilograms annually, which constitutes roughly 4% of the global market. The country’s warm tropical climate, particularly in states like Quintana Roo and Yucatán, provides ideal conditions for dragon fruit cultivation.

One of the primary markets for Mexican dragon fruit is the United States, where it is highly popular, especially among the Asian population. Consumers in the U.S. and Canada favour the yellow dragon fruit variety from What makes Mexico a good source for dragon fruit imports? for its superior sweetness and juiciness compared to other types. Its flavour profile makes it a popular choice for fresh consumption and as an ingredient in smoothies and desserts.

What makes Mexico a good source for dragon fruit imports?’s geographical proximity to the U.S., combined with its ability to produce dragon fruit year-round, ensures a steady and high-quality supply to North American markets. From 2009 to 2022, the country’s dragon fruit production saw a notable increase, with an average annual growth rate of 22.14%. This growth reflects the fruit’s increasing importance to rural economies, offering an alternative income source to traditional crops like corn and beans.

The wholesale price of Mexican dragon fruit is about $2.32 per kilogram, with high-quality fruit in places like Chetumal, and Quintana Roo, priced at around $2.06 per kilogram. This is significantly higher than dragon fruit prices in Asian countries, giving Mexican exports a competitive edge in the North American market. Sustainable and modern farming techniques also play a role in ensuring consistent quality and supply.

This combination of favourable climate, strategic markets, and sustainable practices has positioned What makes Mexico a good source for dragon fruit imports? as a leading dragon fruit exporter in the Americas.

Should I consider importing dragon fruit from Thailand?

From March 2023 to February 2024, Should I consider importing dragon fruit from Thailand? saw a remarkable increase in dragon fruit exports, with 380 batches shipped, marking a 162% year-on-year growth. The country’s primary import partners include India, Russia, and Bangladesh, showcasing Should I consider importing dragon fruit from Thailand?’s diverse export potential.

In terms of flavour, Thai dragon fruit is notable for its unique balance of mild sweetness and earthy notes. This distinct flavour profile sets it apart from other varieties, which may be sweeter or tarter. While some consumers appreciate this unique taste, others may find it less appealing compared to the sweeter red or yellow dragon fruit varieties.

Dragon fruit cultivation in Should I consider importing dragon fruit from Thailand? is primarily concentrated in regions such as Dan Sai and the Phu Ruea District in Loei, where the growing conditions are optimal. The main harvest season runs from April to October, during which approximately 95% of the output is white-fleshed dragon fruit.

Despite the growth in exports, Should I consider importing dragon fruit from Thailand? faces challenges in expanding its market share, particularly in developed countries, due to its proximity to Vietnam, the leading dragon fruit exporter. This geographical positioning complicates Should I consider importing dragon fruit from Thailand?’s efforts to access larger market groups, leading the country to focus on increasing its presence in developing markets instead.

Why import Israeli Golden Dragon Fruit?

Why import Israeli Golden Dragon Fruit? has cultivated a unique and specialized dragon fruit industry, primarily focusing on the Why import Israeli Golden Dragon Fruit?i Golden Dragon Fruit. This variety is distinguished by its yellow skin and white flesh, offering a sweet taste reminiscent of kiwi or pear. Typically, the fruit measures between 9 to 12 cm in length and 7 to 10 cm in width.

The country’s unique climate, particularly in the Negev Desert, provides ideal conditions for growing this yellow-skinned dragon fruit. Why import Israeli Golden Dragon Fruit?’s advanced agricultural techniques, including controlled environments, sophisticated irrigation systems, and greenhouse cultivation, ensure consistent yields and high quality. Additionally, Why import Israeli Golden Dragon Fruit? invests in research and development to enhance dragon fruit’s resistance to pests and diseases, as well as its adaptability to arid climates.

Why import Israeli Golden Dragon Fruit? produces around 2,000 tonnes of dragon fruit annually, primarily for export. The main varieties grown include Bilu and Venus. Due to the relatively small production volume—especially when compared to Vietnam’s 1.2 million tons—Why import Israeli Golden Dragon Fruit? focuses on exporting to large markets. The European Union and the United States remain the primary import destinations for Why import Israeli Golden Dragon Fruit?i dragon fruit, reflecting the country’s strategic emphasis on high-value export markets.

What are the benefits of importing dragon fruit from Taiwan?

What are the benefits of importing dragon fruit from Taiwan?’s subtropical climate is ideal for growing dragon fruit. According to recent reports, the area under dragon fruit cultivation in What are the benefits of importing dragon fruit from Taiwan? is about 1,500 hectares, with the main production areas including Changhua, Pingtung, Nantou, Tainan, and Chiayi. The hot and humid summers and mild winters, along with the volcanic soil, enhance the quality and flavour of What are the benefits of importing dragon fruit from Taiwan?ese dragon fruit. What are the benefits of importing dragon fruit from Taiwan?ese dragon fruit mainly consists of two main types: white-fleshed dragon fruit and red-fleshed dragon fruit, with the main harvest period from June to November every year.

The main importers of What are the benefits of importing dragon fruit from Taiwan?ese dragon fruit have expanded significantly, especially after recent developments in trade agreements and market access. Among them, Japan is one of the largest markets for What are the benefits of importing dragon fruit from Taiwan?ese dragon fruit, with about 18,000 tons of dragon fruit exported to this market in 2023.

What are the benefits of importing dragon fruit from Taiwan?ese dragon fruit farmers are famous for applying advanced agricultural techniques to improve both productivity and quality. These include organic farming practices, pest management systems, and controlled environments such as greenhouses. In addition, What are the benefits of importing dragon fruit from Taiwan? is developing new dragon fruit varieties with better disease resistance and better flavour through hybridization and selective research.

Conclusion

The world’s leading dragon fruit producers each bring unique strengths to the table. Importers should carefully evaluate their specific needs and conditions when selecting a supplier. For instance, if the demand leans toward red-fleshed and white-fleshed varieties, Vietnam stands out as the optimal choice due to its high domestic production capacity. Conversely, for those seeking yellow-skinned dragon fruit, Why import Israeli Golden Dragon Fruit? and What makes Mexico a good source for dragon fruit imports? present attractive options worth exploring.

Additionally, importers should take into account the primary and secondary crop seasons in these countries to secure the most competitive pricing. Understanding the seasonal availability can help maximize both quality and value in their procurement strategies.

See more:

  • Top Countries Importing Dragon Fruit: A Comprehensive Analysis
  • Health Benefits of Dragon Fruit: Why It’s Becoming Popular Among Global Consumers
October 20, 2024 0 comment
0 FacebookTwitterLinkedinWhatsapp
Fruit & Vegetable

Import Dragon Fruit from Vietnam. A Guide for International Buyers

by Henry Truong October 12, 2024
written by Henry Truong

Dragon fruit, or pitaya, originates from Central America, particularly in Mexico, Guatemala, and Costa Rica. This vibrant fruit belongs to the cactus family (Cactaceae) and is known by various names, including “pitahaya” and “pitaya roja” in Latin America and “strawberry pear” in the United States.

Renowned for its delicious flavour and nutritional benefits, dragon fruit is rich in fibre, vitamin C, and antioxidants. In Vietnam, it gained popularity in the early 20th century, with the first cultivation in Binh Thuan province, which later spread across the country.

Today, Vietnam stands as one of the world’s largest dragon fruit exporters. The export value has surged from $57.15 million in 2010 to over $100 million in 2011. Between 2017 and 2020, annual exports consistently exceeded $1 billion. Major importers of Vietnamese dragon fruit include China, India, the United States, Thailand, the Netherlands, and Japan.

What makes Vietnamese dragon fruit so sought after? Why should importers prioritize Vietnam in their sourcing strategies? The following sections will delve into the key factors that establish Vietnam as a premier source of dragon fruit.

Why is Vietnam’s climate ideal for growing dragon fruit?

Vietnam’s climate is exceptionally well-suited for cultivating a diverse range of dragon fruit varieties, including white-fleshed (Hylocereus undatus), red-fleshed (Hylocereus costaricensis), yellow (Hylocereus megalanthus), and various hybrids (Hylocereus spp.). This ideal environment allows for year-round harvesting, with peak season typically occurring from June to September.

This plant thrives in bright sunlight, requiring 8 to 12 hours of light daily for optimal growth and fruit production. Additionally, dragon fruit prefers loose, nutrient-rich soil with excellent drainage, such as sandy or alluvial soil. Given Vietnam’s extensive land area, each region provides unique advantages for cultivating different types of dragon fruit.

Binh Thuan province, often regarded as the “capital” of dragon fruit cultivation, enjoys abundant sunshine, averaging 2,500 to 2,700 hours annually. This ample sunlight supports photosynthesis and robust growth. The sandy loam in Binh Thuan offers excellent drainage and features a short saline season coupled with a long dry season. By the end of 2023, Binh Thuan had approximately 26,500 hectares dedicated to dragon fruit cultivation, yielding around 570,000 tons annually, with 80% designated for export.

In contrast, Long An province’s climate and soil are ideally suited for red-fleshed dragon fruit. Situated in the Mekong Delta, Long An boasts some of the richest alluvial soil in Southeast Asia, which enhances nutrient absorption for dragon fruit trees. Despite the rainy season lasting up to six months, effective drainage systems and careful management by local farmers prevent waterlogging, allowing the trees to thrive stably throughout the season.

What quality standards does Vietnamese dragon fruit meet for export?

To meet the rigorous demands of the international market and ensure high quality, Vietnamese dragon fruit adheres to a comprehensive range of production standards. These certifications are crucial for enhancing product quality, building trust with global consumers, and facilitating seamless export. Key standards that Vietnamese agricultural products, including dragon fruit, frequently comply with include:

  1. VietGAP (Vietnam Good Agricultural Practices)
    Objectives:
  • Ensure food safety and protect consumer health.
  • Promote sustainable and environmentally responsible agricultural practices.

Details:

  • Production Management: VietGAP mandates that producers follow clear processes throughout production, from land preparation and seed selection to plant care, harvesting, and preservation.
  • Pesticide Use: The use of toxic chemicals is restricted; only approved pesticides may be used, adhering to proper dosage and pre-harvest isolation periods.
  • Record Keeping: Comprehensive documentation of production activities is required to ensure transparency and facilitate the tracking of product origins and quality control.
  1. GlobalGAP (Global Good Agricultural Practices)
    Objective:
  • Meet international markets’ quality and food safety requirements, particularly in Europe and North America.

Details:

  • Food Safety Management: GlobalGAP emphasises the identification and control of hazards throughout agricultural production, from planting to the final consumer.
  • Environmental Protection: Production processes must be environmentally sustainable, focusing on effective water management, biodiversity conservation, and waste minimization.
  • Social Welfare: The rights of workers must be upheld, ensuring safe working conditions, occupational safety, and additional benefits.
  1. HACCP (Hazard Analysis and Critical Control Points)
    Objective:
  • Ensure food safety throughout the entire production and processing chain.

Details:

  • Hazard Analysis: Businesses must analyze and identify potential hazards in food production, proposing effective control measures accordingly.
  • Critical Control Points (CCPs): These are specific points in the production process where hazards can be managed. Businesses are required to identify and monitor these points to ensure product safety.
  • Recording and Checking: Procedures for monitoring and control must be documented to maintain transparency and traceability.

As of the end of December 2022, approximately 11,006 hectares of dragon fruit in Binh Thuan province have received VietGAP certification, accounting for 40% of the province’s total area. Notably, 80% of this certified area is also recognized by GlobalGAP. Long An province boasts over 4,000 hectares of red-fleshed dragon fruit certified by VietGAP. This number is continually increasing, as Vietnam’s policy aims to maintain output while enhancing the quality of dragon fruit, thereby boosting its market share in developed countries.

How competitive is the pricing for Vietnamese dragon fruit?

Vietnamese dragon fruit offers highly competitive pricing, particularly during its peak harvest season, thanks to an abundant supply. During this period, average prices typically range from 5,000 VND/kg to 11,000 VND/kg (approximately $0.21 to $0.46). While off-season prices increase due to lower output—with white-fleshed Grade 1 reaching 20,000-23,000 VND/kg ($0.85-$0.97) and red-fleshed Grade 1 commanding 37,000-40,000 VND/kg ($1.57-$1.70)—Vietnam consistently maintains a significant price advantage.

When compared to other Southeast Asian countries, the price of dragon fruit in Vietnam is 20-30% lower. This is largely due to Vietnam’s ability to produce 3-5 times the output of its regional competitors. Additionally, numerous free trade agreements enhance Vietnam’s export capacity for dragon fruit and its products. Key agreements include the Comprehensive and Progressive Agreement for Trans-Pacific Partnership (CPTPP), the Vietnam – EU Free Trade Agreement (EVFTA), the Vietnam – Korea Free Trade Agreement (VKFTA), and the ASEAN – China Free Trade Agreement (ACFTA). These agreements often exempt dragon fruit from tariffs or significantly reduce them, allowing importers to save 10-20% on costs.

Does Vietnam have a stable supply of dragon fruit for international buyers?

Yes, Vietnam is deeply committed to ensuring a stable and sustainable supply of dragon fruit for international buyers through a robust government development strategy. For the 2025-2030 period, the Ministry of Agriculture and Rural Development aims to stabilize the dragon fruit cultivation area at approximately 60,000 to 65,000 hectares, targeting an impressive annual output of 1.3 million to 1.5 million tons. This commitment is supported by local efforts to implement advanced production processes, enhancing productivity, quality, food safety, and traceability across all cultivation regions.

Specifically, in Binh Thuan, by 2030, the province aims to maintain a dragon fruit area of about 25,000 hectares, achieving an average yield of 22 tons per hectare and an annual output of 550,000 tons. Additionally, it is projected that 70% of the product value will come from cooperative and associative production forms, with 70-75% of the dragon fruit area adhering to good agricultural practices (VietGAP and equivalents).

In Long An, the goal is to stabilize the dragon fruit area at around 8,000 to 10,000 hectares, targeting an output of 250,000 to 300,000 tons. This plan includes designating approximately 60% of the area for harvest and ensuring that 40% is allocated for the main season’s production.

Conclusion

Vietnamese dragon fruit, originating from Central America, has developed strongly into one of the country’s key agricultural export products. Outstanding factors such as high quality, variety diversity, and strict production standards have helped Vietnamese dragon fruit dominate the international market. The application of advanced production processes such as VietGAP and GlobalGAP not only increases product value but also ensures food safety for consumers. With competitive prices and support policies from the government, Vietnamese dragon fruit not only has advantages in quality but also in price, helping importers save costs. Therefore, Vietnamese dragon fruit is affirming its solid position in the global market and has prospects for sustainable development in the future.

See more:

  • Vietnam Dragon Fruit: Gradually Regaining Global Leadership
  • Durian, Dragon Fruit, Mango: Driving Vietnam’s Export Success
  • Vietnam’s fruit and vegetable exports: Key markets, challenges, and opportunities
October 12, 2024 0 comment
0 FacebookTwitterLinkedinWhatsapp
Fruit & Vegetable

Why Choose Limes from Vietnam? A Guide for International Buyers

by Henry Truong October 12, 2024
written by Henry Truong

What makes Vietnamese limes a high-quality choice for importers?

Vietnamese limes are recognized for their superior quality, making them an excellent choice for international importers. They come in two main varieties: seedless limes and purple-flowered limes, both known for high yields and premium characteristics. These include large fruits, thin skins, a refreshing sour taste, and a distinctive aroma. Seedless limes are particularly popular for export due to their lack of seeds, even thinner skins, and higher juice content compared to regular limes, all while meeting stringent international export standards.

Vietnamese limes not only guarantee quality but also meet international sustainability standards. Many growing areas have been certified with VietGAP and GlobalGAP, ensuring farming practices do not harm the environment and comply with strict food safety regulations. Adherence to these standards makes Vietnamese limes more accessible to demanding markets like the EU and the USA, which have high environmental and safety requirements.

Why is Vietnam’s climate perfect for growing limes year-round?

Vietnam’s climate, particularly in the Mekong Delta, provides ideal conditions for year-round lime cultivation. This region benefits from a tropical monsoon climate with stable average temperatures between 25-30°C and high humidity, enabling continuous growth. Abundant annual rainfall, ranging from 1,200 mm to 2,500 mm, ensures sufficient water, especially during the rainy season (May to November). The flat delta terrain, characterized by fertile alluvial soil, excellent drainage, and moisture retention, creates optimal conditions for lime trees. Furthermore, an extensive river system and ample sunlight (2,000 – 2,600 hours/year) not only support robust growth but also facilitate efficient transport of agricultural products.

These factors make Vietnam’s Mekong Delta an ideal lime-growing region, producing high yields and quality fruits to meet both domestic and export demands.

What is Vietnam’s lime production capacity for export?

Where are limes grown in Vietnam for export?

Limes for export in Vietnam are primarily cultivated across the Mekong Delta provinces. Long An province leads with the largest planting area, exceeding 11,000 hectares, specifically known for its seedless and purple-flowered lime varieties. Đồng Tháp province also makes a significant contribution, with 1,300 hectares in Cao Lanh district and over 500 hectares in Chau Thanh district. Additionally, provinces such as Soc Trang, Hau Giang, and Tien Giang maintain considerable lime cultivation areas, with Hau Giang dedicating 700 hectares of seedless limes primarily in Chau Thanh district.

When are Vietnamese limes harvested and what are the typical yields?

Vietnamese limes are typically harvested during two main seasons annually. The off-season harvest, occurring during the dry period from December to April, often sees prices 35-45% higher than the main season, which runs from May to November during the rainy period. Lime trees generally begin to bear fruit after 18-20 months, with an average yield of 15-20 tons per hectare in the initial harvest. In subsequent years, yields can increase significantly, reaching 25-35 tons per hectare, with some regions achieving up to 40 tons per hectare.

With the current cultivation area and yield, Vietnam can supply the international market with at least 350,000 to 500,000 tons of limes annually. Additionally, due to the characteristics of the harvest seasons, Vietnam can provide limes year-round, ensuring a stable supply for the market.

How do Vietnamese lime prices compare to other exporting countries?

Vietnamese limes offer highly competitive pricing compared to those from other exporting countries, primarily due to lower production costs and inherent natural advantages. The ability to produce limes year-round not only ensures a consistent supply but also helps maintain stable prices. This translates into significant cost benefits for importers without any compromise on product quality. Consequently, international buyers who choose Vietnamese limes can secure a competitive edge in the global market, benefiting from both reasonable prices and high-value products.

Conclusion

Vietnam is a top choice for international importers seeking high-quality limes at competitive prices. With natural advantages, strong production capacity, investment in high-tech agriculture, and adherence to sustainability standards, Vietnamese limes promise to deliver significant value to global markets. Explore the opportunities of importing limes from Vietnam now to gain a competitive advantage for your business.

October 12, 2024 0 comment
0 FacebookTwitterLinkedinWhatsapp
Fruit & Vegetable

Harvest of Limes and Lemons: Best Times for Import

by Henry Truong October 11, 2024
written by Henry Truong

In the context of globalization and the increasing demand for high-quality limes and lemons, understanding their seasonality is crucial. This helps import businesses ensure a stable supply of high-quality products at reasonable costs.

This article aims to help importers identify the best times to import limes and lemons from key producing regions globally and provide strategies for maintaining year-round supply.

When is the best time to import limes and lemons globally?

To ensure a stable, cost-effective, and year-round supply of high-quality limes and lemons, importers should strategically combine harvests from both the Northern and Southern Hemispheres. The Northern Hemisphere typically harvests from late spring to autumn, while the Southern Hemisphere provides supply during winter and early spring, allowing for continuous availability regardless of the season.

Climate and geography directly influence harvest cycles. For example, in Mediterranean climate countries like Spain, lemons tend to be harvested in the summer, while in countries like South Africa and Brazil, the harvest season extends from winter to spring, providing an advantage in supplying during the off-season in the Northern Hemisphere.

The combination of harvest seasons in both hemispheres helps maintain a year-round supply, allowing import businesses to always have available stock to meet market demand.

The importer and exporter of Lemons/Limes. Source: oec.world

Which countries are key suppliers of limes and lemons, and when do they harvest?

Mexico

Mexico is the world’s largest exporter of limes, with an export value of $715.65 million, accounting for 19.01% of the global market.

  • Main varieties: Mexico is known for Key limes (Mexican limes) and Persian limes.
  • Key limes are small, have a strong sour taste, and thin skin, widely used in culinary applications. Persian limes are larger, have thicker skin, and are easier to preserve.
  • Harvest time: May – September, with year-round availability.

Spain

Spain is the world’s largest lemon exporter with a value of $857.8 million, accounting for 22.57%of the global market.

  • Main varieties: Spain produces Fino lemons and Verna lemons.
  • Fino lemons have a strong flavour and thin skin, harvested in winter. Verna lemons are larger have fewer seeds and are harvested in summer.
  • Harvest time: May – September.

Brazil

Brazil exports limes with a value of $351.3 million, accounting for 9.24% of the global market.

  • Main varieties: Brazil is known for Persian limes and Key limes. Persian limes are of high quality and are well-preserved, making them suitable for export.
  • Harvest time: August – October.

South Africa

South Africa accounts for 9.51% of the global market with an export value of $397 million.

  • Main varieties: South Africa produces Eureka lemons and Key limes. Eureka lemons have thick skin and a strong flavour, suitable for long-distance export.
  • Harvest time: March – October.
  • Main markets: Europe, Middle East.

Turkey

Turkey exports $288 million, accounting for 9.43% of the global market.

  • Main varieties: Turkey produces Enterdonato lemons and Lamas lemons. Enterdonato lemons have thin skin and high juice content.
  • Harvest time: September – December.
  • Main markets: Russia, Middle East, Europe.

Egypt

Egypt’s export value is approximately $150 million.

  • Main varieties: Baladi lemons, small in size with thick skin and strong sour flavour.
  • Harvest time: March – July.
  • Main markets: Europe, Middle East.

Vietnam

Vietnam is increasing its presence in the international market, mainly exporting to Asian and European countries.

  • Main varieties: Key limes and Vietnamese limes. Vietnamese limes have a mild sour taste and thin skin, suitable for both domestic and international markets.
  • Harvest time: Year-round, with peak season from May to August.
  • Main markets: Asia, Europe, North America.

See more: Why Choose Limes from Vietnam? A Guide for International Buyers

Netherlands

The Netherlands re-exports $351.3 million worth of lemons and limes, accounting for 9.24% of the global market.

  • Role: The Netherlands imports and re-exports lemons from countries like South Africa, Brazil, and Spain.
  • Re-export time: Year-round
  • Main markets: Europe.

How can importers ensure a year-round supply of limes and lemons?

Importers can ensure a steady, year-round supply of limes and lemons by strategically sourcing from countries in opposite hemispheres during their respective peak seasons. For instance, when Northern Hemisphere producers like Spain and Turkey are in their off-season, Southern Hemisphere countries such as South Africa and Brazil can fill the supply gap with their peak harvests. Additionally, re-export hubs like the Netherlands play a crucial role in redistributing these fruits globally, further stabilizing the supply chain.

What are the optimal import windows for limes and lemons from major producing regions?

Generally, the best times to import limes and lemons from each region can be summarized as follows:

  • Mexico: May – September
  • Spain: May – September
  • Brazil: August – October
  • South Africa: March – October
  • Turkey: September – December
  • Egypt: March – July
  • Vietnam: Year-round, with peak season from May to August

What other factors should importers consider when sourcing limes and lemons?

Beyond understanding seasonal availability, importers must also account for critical factors such as transportation times, potential price fluctuations, and efficient logistics to optimize their supply chain. Furthermore, ensuring products meet international certifications like Global GAP, Organic, or Fair Trade is essential for guaranteeing high quality, sustainability, and market compliance.

Conclusion

Understanding the seasonality of limes and lemons helps importers optimize their supply chain and ensure products remain fresh at reasonable costs. Leveraging the seasonal differences between the hemispheres allows businesses to maintain a year-round supply, maximizing profits and meeting market demand.

See more: Top Countries Exporting Limes: Where to Source the Best Quality

October 11, 2024 0 comment
0 FacebookTwitterLinkedinWhatsapp
Fruit & Vegetable

Top Countries Exporting Limes: Where to Source the Best Quality

by Henry Truong October 11, 2024
written by Henry Truong

Which countries lead the global lemon and lime export market?

In 2023, Spain led the global lemon and lime export market, capturing 22.57% of the share with an export value of $857.8 million. Following Spain, Mexico secured the second position, holding a 19.01% market share and exporting $715.65 million, primarily to the United States. South Africa ranked third, controlling 9.51% of the market with $361.55 million in exports. Turkey and the Netherlands also played significant roles, holding 9.43% and 9.24% of the global market share, respectively.

In contrast, the United States is the largest importer of lemons/limes, with imports valued at $1.1 billion, reflecting an 11.82% increase. India remains the top producer of Lemons/Limes, with a production volume of 3.8 million tons in 2022, despite a 3.4% decrease. These numbers demonstrate the growing demand for high-quality Lemons/Limes in the global market.

Who are the top lemon and lime exporters in 2023?

1. Spain

Spain is the world’s largest limes exporter, accounting for 22.57% of the global market. Spanish Lemons/Limes are prized for their thin skins, bright yellow colour, and high juice content.

  • Product Characteristics: Spain produces high-quality Lemons/Limes thanks to its Mediterranean climate, resulting in rich flavours and appealing aesthetics.
  • Export Volume & Key Markets: Spain primarily exports to Germany, with $239 million of Lemons/Limes sent there, making up a significant portion of their total exports.

2. Mexico

Mexico is the second-largest limes exporter, with an export value of $715.65 million in 2023, holding 19.01% of the global market.

  • Product Characteristics: Mexican Lemons/limes are known for their consistent quality and competitive pricing. They are mildly sour, with thicker skins, allowing for longer shelf life during transportation.
  • Export Volume & Key Markets: Mexico primarily exports to the United States, which consumes the majority of its Lemons/Limes exports.

3. South Africa

South Africa controls 9.51% of the global limes export market, with an export value of $361.55 million.

  • Product Characteristics: South African Lemons/limes stand out for their long shelf life, bright colour, and strong acidic flavour. The country’s temperate climate helps maintain freshness, making its Lemons/Limes highly sought after in European markets.
  • Export Volume & Key Markets: South Africa’s Lemons/Limes are mainly exported to European markets, particularly the Netherlands.

4. Turkey

Turkey’s limes exports reached $358.59 million, accounting for 9.43% of the global market. Turkish Lemons/Limes exports have surged in recent years.

  • Product Characteristics: Turkish Lemons/Limes have thin skins, fragrant aromas, and high juice content. Popular varieties like Enterdonato and Lamas are grown in ideal climatic conditions, ensuring consistency in quality.
  • Export Volume & Key Markets: Turkey exports lime primarily to Europe and the Middle East.

5. Netherlands

The Netherlands ranks fifth, holding a 9.24% market share with an export value of $351.3 million.

  • Product Characteristics: Though not a large producer, the Netherlands plays a key role in re-exporting Lemons/Limes. The country imports high-quality Lemons/Limes, which are strictly inspected before being redistributed across Europe.
  • Export Volume & Key Markets: The Netherlands is a major re-exporter of Lemons/Limes, sourcing from multiple countries to supply various European markets.

What are the current trends and future outlook for global lime imports?

Global lime import trends indicate consistent growth, especially across Europe, North America, and Asia, driven by a rising demand for natural, vitamin-rich products. Europe continues to be the largest importing region, with Spain and Argentina serving as its primary suppliers.

Import Trends: Major importers such as the United States, Germany, and the Netherlands continue to see steady growth in lemons/limes imports.

Future Outlook: The global lemon/limes market is expected to continue growing due to the increasing demand for healthy and natural products. Spain and Mexico are likely to maintain their leadership positions, while South Africa and Turkey are expected to expand their market presence.

What should you consider when sourcing high-quality lemons and limes?

When sourcing high-quality lemons and limes, it is essential to evaluate key factors such as size, weight, skin texture, and juice content. Furthermore, prioritizing suppliers with certifications in sustainable agriculture, like Global GAP, Organic, or Fair Trade, is crucial to ensure the product adheres to international quality and ethical standards.

Conclusion

Spain, Mexico, South Africa, Turkey, and the Netherlands are the top players in the global limes export industry. Each country has distinct advantages in terms of growing conditions and export markets, making it easier for businesses to find suitable suppliers that meet their quality and market demands. With the global demand for Lemons/Limes continually rising, these nations are well-positioned to maintain and expand their influence in the international market.

See further: Harvest of Limes and Lemons: Best Times for Import

October 11, 2024 0 comment
0 FacebookTwitterLinkedinWhatsapp
Fruit & Vegetable

Vietnam’s Banana Exports: Exceptional Growth & Hidden Challenges

by Henry Truong October 8, 2024
written by Henry Truong

Where are bananas grown in Vietnam?

Vietnam boasts over 130,000 hectares of banana plantations, yielding 2.1 million tons annually and representing 19% of the nation’s total fruit-growing area. Approximately 80% of this output is destined for export, predominantly South American banana varieties, complemented by local and Laba varieties. Dong Nai province stands out as a key banana-growing region, contributing 13,149 hectares (8.53% of the country’s banana area), with Trang Bom district being a primary hub where yields can reach an impressive 40-45 tons per hectare.

In 2023, banana exports ranked 3rd among Vietnam’s fruit exports, generating $308 million, behind durian and dragon fruit. By mid-2024, Vietnam exported 420,000 tons of bananas to China, with export turnover reaching $220 million—an 18% increase over the same period in 2023.


How are Vietnam’s banana exports to China performing?

Vietnam’s banana exports to China have shown remarkable growth, particularly after the fresh banana export protocol was signed on November 1, 2022. Following steady increases from 2018 to 2021, exports surged from $260 million in 2021 to $310.6 million in 2022—a 34.2% jump. This robust performance continued into 2023, maintaining export revenues exceeding $300 million, underscoring China’s critical role as a market for Vietnamese bananas.

The Chinese market, accounting for nearly 90% of Vietnam’s banana exports, is key to this growth. In 2023, China imported 1.77 million tons of bananas worth $1.08 billion. Among its top suppliers were the Philippines (686,000 tons), Vietnam (506,000 tons), Ecuador (266,000 tons), and Cambodia (263,000 tons), with these four countries providing 97% of China’s banana imports.

In 2024, the impact of Panama disease on Philippine bananas drove prices up to $524 per ton, prompting China to reduce imports from the Philippines and shift to Vietnam.

Philippine banana imports to China dropped by 39.3% in the first half of 2024. Meanwhile, due to conflict and instability in the Red Sea, rising transport costs for Ecuadorian bananas also benefited Vietnam and Cambodia. Both countries saw increased exports to China as a result.

Bananas are now the most imported fruit in China, surpassing durian (1.43 million tons) and coconut (1.18 million tons). In terms of revenue, bananas rank 4th, following fresh durian ($6.72 billion), cherries ($2.65 billion), and frozen durian (over $1 billion).


Data from 2023 to June 2024

What is the current state of Vietnam’s banana exports to Japan and South Korea?

Vietnam’s banana exports to Japan and South Korea are experiencing significant shifts. In Japan, a trade agreement effective April 1, 2024, eliminated the 3% import tax on bananas, leading to a substantial surge in Vietnamese exports. In the first seven months of 2024, Vietnam exported 7,900 tons of bananas to Japan, valued at 1.05 billion yen ($7.1 million), representing a 62% increase in volume and an 80.2% rise in value compared to the same period in 2022. This gives Vietnam a competitive advantage over the Philippines, which now faces a 13% import tax despite previously dominating the Japanese market. Given Japan’s annual $1 billion banana import market, Vietnam’s current 1.3% share indicates immense growth potential. Similarly, South Korea, which imports nearly 100% of its bananas, presents a promising market. In the first half of 2024, South Korea imported $35.6 million worth of bananas from Vietnam, making it Vietnam’s second-largest banana export market after China. Despite ranking 6th among suppliers, Vietnam has considerable potential to expand its share in South Korea’s $300 million annual banana import market.

What are the most promising banana export markets for Vietnam?

Analysis of banana imports across the world’s top six markets highlights significant untapped potential for Vietnamese bananas, particularly in European, American, and Japanese markets. European markets, for instance, are expanding their banana imports by an average of 20% annually. Currently, these regions are predominantly supplied by bananas from Ecuador, the Philippines, Costa Rica, and Colombia, indicating a clear opportunity for Vietnam to diversify its export destinations beyond its traditional markets.


European and American markets account for 26.7% and 21.5% of global banana import demand, respectively. While the Chinese market offers considerable opportunities, it may not sustain long-term growth, as China is also one of the largest banana-producing countries. In 2023, banana consumption in Europe is estimated to reach 661,487 tons, marking a 13% increase from 2022, with continued growth expected in 2024.

India, the world’s largest banana producer, had an output of 31 million tons from 878,000 hectares in 2020. Given its significant domestic production, India is unlikely to increase banana imports significantly in the future. Relying heavily on the Chinese market may not be sustainable in the long run, especially as the banana epidemic in the Philippines resolves, which could stabilise banana prices and reduce Vietnam’s exports to China.

Vietnamese businesses should target potential markets like Japan, which offers a preferential tax rate of 0%, along with South Korea and, importantly, Europe. Given the ongoing complexities surrounding war and the Red Sea, sourcing goods from the East Asia region is essential. Vietnam’s favourable climate, extensive coastline, and absence of banana diseases create a competitive advantage against the Philippines in the Chinese, Japanese, and European markets.

Although the Philippines is the second-largest banana-producing country after Ecuador, its banana prices are expected to remain low. However, imports of Philippine bananas do not benefit from tax exemptions. Consequently, countries importing from the The Philippines face taxes ranging from 10% to 40% on the total value of imported goods, positioning Vietnamese bananas as a more attractive option in the global market.


Who are Vietnam’s main competitors in the global banana market?

Vietnam faces significant competition in the global banana market, primarily from the Philippines, which currently dominates exports to key markets like Japan, South Korea, China, and New Zealand. For example, the Philippines supplies an overwhelming 98.7% of South Korea’s banana imports, which constitute 48.7% of the country’s total fruit imports. Beyond the Philippines, Vietnam must also contend with emerging competitors such as India and established players like Guatemala, both of whom are actively expanding their export footprints.

India’s banana exports were valued at approximately $142.9 million in 2021, representing just 1% of global exports, as most bananas produced in India are consumed domestically. However, in the past three years, Indian banana exports have surged by 300%. The National Plantation Board of India has also proposed a plan to export over 75,000 tons of bananas in the coming years, aiming to position bananas as a significant export product for the country.

Guatemala has seen steady growth in banana exports, largely driven by increasing demand in the U.S. market. The country benefits from favorable growing conditions and previous investments aimed at expansion, resulting in an abundant supply of low-cost bananas. This has facilitated Guatemala’s export growth, particularly to the United States, the primary destination for its bananas. With an average export price of $380 per ton, Guatemalan bananas remain among the most competitively priced on the global market.

As Vietnam looks to expand its banana exports, it must carefully navigate this competitive landscape, leveraging its unique advantages while addressing the challenges posed by established players like the Philippines, India, and Guatemala.

Conclusion

Vietnam’s banana exports are poised for significant growth, particularly in major markets such as China, Japan, South Korea, and Europe. The recent signing of favourable trade agreements, including the reduction of banana import taxes to 0% for Japan, presents Vietnam with a valuable opportunity to enhance its competitive edge in the global market. The rising demand for bananas in both China and Europe highlights the substantial potential for Vietnamese bananas.

Nevertheless, Vietnam faces stiff competition from other countries, notably the Philippines, India, and Guatemala. The Philippines remains the primary supplier of bananas to Japan, South Korea, and China. Concurrently, India has ramped up its banana exports significantly in recent years, while Guatemala has made remarkable strides in the U.S. market with competitively priced bananas.

To fully harness this potential, Vietnam must prioritize improving product quality, adhering to international standards, and developing effective marketing strategies. Diversifying export markets beyond China will also be crucial for ensuring the sustainability of the banana export industry in the long term. With its favourable natural conditions, Vietnam is well-positioned to assert itself in the global banana market.

See more: Vietnam’s fruit and vegetable exports: Key markets, challenges, and opportunities

October 8, 2024 0 comment
0 FacebookTwitterLinkedinWhatsapp
Fruit & Vegetable

Durian, Dragon Fruit, Mango: Driving Vietnam’s Export Success

by Henry Truong October 6, 2024
written by Henry Truong

Why is Vietnamese Durian Exporting So Much?

Vietnamese durian exports have seen a remarkable surge, skyrocketing from $29.2 million in 2016 to $2.3 billion in 2023, largely due to dedicated efforts by farmers and the government to enhance product quality and secure crucial trade agreements. This growth is supported by an expanding cultivation area, projected to reach 150,000 hectares and yield 1.5 million tons by 2024, with significant profits per hectare. Key cultivation regions include the Central Highlands (40.4%), Mekong Delta (34.6%), Southeast region (19.4%), and South Central Coast (5.6%).

High prices and growing export demand have fueled the rapid expansion of durian cultivation, especially in the Central Highlands, where the planting area has increased 2.5 times from 2021 to 2023. Newly planted durian trees are primarily grown in specialized gardens, shifting away from the intercropping with coffee that was common in the past.

In Q1 2024, durian became Vietnam’s top fruit export, reaching a turnover of $254 million—a 66% rise from the same period in 2023. China accounts for 98% of Vietnam’s total durian exports. Data from the Chinese Customs Authority shows that China imported 53,110 tons of fresh durian in the first two months of 2024, with Vietnam surpassing Thailand as the leading exporter by shipping 32,750 tons worth $161 million—a 2.4 times increase compared to the previous year. Vietnam’s market share in China grew from 32% in 2023 to 57% in early 2024. Chinese consumers spent $6.7 billion on imported fresh durians last year, making it China’s largest fresh fruit import by value, overtaking cherries.

Vietnamese durian retains a strong competitive advantage in China due to its large production and year-round availability, which avoids competition with Thailand’s peak durian season. Additionally, fast shipping and competitive pricing have contributed significantly to Vietnam’s rapid growth in this market.

To meet the stringent export standards in markets like the EU and the U.S., Vietnamese companies are investing in drying technology to achieve a 35% dry matter content in durian. This improvement boosts quality, enhances market value, and extends shelf life up to 30 days. However, despite these advancements, most businesses still rely on manual packaging, achieving only 28% dry matter content and a shorter preservation time of 12-13 days.

What Makes Vietnamese Dragon Fruit a Top Export?

Vietnamese dragon fruit stands out as a top export due to its extensive cultivation, covering approximately 55,000 hectares and yielding over 1.2 million tons in Q1 2024. The primary growing regions are Binh Thuan (62.5%), Long An (18.7%), and Tien Giang (17%), with Binh Thuan specializing in white-fleshed varieties and red-fleshed dragon fruit thriving in Long An, Tien Giang, and Dong Nai.

Binh Thuan alone accounts for 27,000 hectares, with 40% adhering to VietGAP standards and 355 hectares meeting GlobalGAP standards. The adoption of the lantern technique has enabled year-round harvests, with peak season from April to September and off-season from October to March. This year-round availability gives Vietnam a competitive advantage in export markets.

Vietnam’s dragon fruit export value rose from $57.15 million in 2010 to over $1.3 billion by 2018, remaining above $600 million in recent years. Until 2023, dragon fruit was Vietnam’s top fruit export before being surpassed by durian. China remains the largest market (92% of exports), followed by Singapore, Hong Kong, and Indonesia. In the EU, export value is modest at $9-12 million, with the Netherlands (75%) as the main importer. Thanks to the 0% tax from the EU-Vietnam Free Trade Agreement (EUVFTA), Vietnam is poised to expand its market share in the EU.

Understand more about the Vietnam dragon fruit export here: Vietnam What Makes Vietnamese Dragon Fruit a Top Export?: Gradually Regaining Global Leadership

How Are Vietnamese Mangoes Performing in Global Markets?

How Are Vietnamese Mangoes Performing in Global Markets?es play a vital role in Vietnam’s agriculture, especially in regions like Dong Nai, Son La, Dong Thap, and An Giang. As per the Department of Crop Production, Vietnam cultivates mangoes across more than 115,000 hectares, producing nearly 969,000 tons annually. About half of this area is in the Mekong Delta, with nearly 2,000 hectares meeting VietGAP and GlobalGAP standards, representing 4% of the total mango-growing region.

China is Vietnam’s largest mango export market, accounting for 84% of the total export value, or around $152 million USD. Other key markets include Russia, the US, South Korea, the EU, Australia, and Japan. Since 2019, the US has been importing both frozen and fresh mangoes from Vietnam. In 2023, the US imported 643 tons of frozen mangoes worth $988,000 and 500 tons of fresh mangoes valued at $1.4 million. The main exported varieties are green-skinned mango, Hoa Loc mango, and yellow-skinned mango.

Despite the recognized quality of Vietnamese mangoes, their market share in the US remains small, with total US mango imports reaching 554,000 tons. In comparison, Thailand exports 19,000 tons to the US, ten times more than Vietnam, and the Philippines exports 2,600 tons, 40% higher than Vietnam. This gap highlights the untapped potential for Vietnamese mangoes in the US market.

One of the major challenges is the lengthy sea transport, taking 30-35 days, which, coupled with inadequate processing and packaging, affects the quality of mangoes. While some businesses are working to address these issues, significant improvement will require more investment and support from the government and large corporations.

Despite these challenges, Vietnam’s mango exports to the US are showing promising growth. In 2023, Vietnam experienced a 111% increase in both output and value, marking the highest growth among mango-exporting countries to the US. If this trend continues, Vietnamese mangoes could surpass those from the Philippines in the US market.

What is the Export Potential for Vietnamese Vegetables?

Vietnam’s vegetable exports hold significant potential, driven by favorable year-round weather conditions that allow for diverse cultivation across various regions. While vegetables currently contribute modestly to total agricultural exports, areas like Da Lat (Lam Dong), Moc Chau (Son La), Sa Pa (Lao Cai), and the Northwest Mountains provide ideal environments for temperate vegetables and flowers. The northern winter crop season further supports low-cost cultivation of sub-temperate and tropical vegetables, positioning Vietnam to become a leading global ‘vegetable garden’ and culinary hub through expanded production.

By 2023, Vietnam’s vegetable cultivation area reached 995,000 hectares, spread across seven regions: Red River Delta, Northern Midlands and Mountains, North Central, South Central Coast, Central Highlands, Southeast, and Mekong Delta. The Red River Delta, the largest production region, holds nearly 25% of the total area and contributes almost 30% to the output. However, only 15% of the total cultivation area meets safety standards.
Carrots are a major export, with 65,000 tons exported during the 2022-2023 winter-spring crop, accounting for 80% of the total production. Besides established markets like Korea, Japan, Singapore, Malaysia, and the Middle East, Vietnamese carrots are expanding to new markets such as the US, France, and European and Muslim countries.

Despite this progress, Vietnam’s vegetable exports represent only 2-3% of global fruit and vegetable exports, signalling significant growth potential. With 16 of 19 free trade agreements in effect, Vietnamese agricultural enterprises are increasingly aligning with VIETGAP/GLOBALGAP standards, positioning themselves to meet the EU’s stringent Technical Barriers to Trade (TBT) and Sanitary and Phytosanitary (SPS) measures. This presents a great opportunity for countries facing adverse climatic conditions and high agricultural costs.

In 2021, Vietnam’s vegetable exports totalled $250 million, with chilli contributing $63 million, sweet potatoes $37 million, cauliflower $17 million, and a combined $16 million from corn and other vegetables. By 2023, the export value increased to $279 million, and by the end of 2024, vegetables are projected to account for 7.13% of total agricultural exports. High-potential export vegetables include tomatoes, cucumbers, beans, corn, carrots, cabbage, radishes, asparagus, onions, garlic, potatoes, zucchini, and mushrooms.

Mr. Dang Phuc Nguyen, General Secretary of the Vietnam Fruit and Vegetable Association, stressed the importance of complying with the EU’s stringent quality and safety standards, requiring products to be free of pesticide residues before export. To meet these demands, Vietnamese exporters must obtain GlobalGAP certification and rigorously control pesticide and plant protection residues. Overcoming these technical barriers is crucial to ensuring smooth market access and avoiding rejection or return of goods.

Conclusion

Despite these achievements, Vietnam’s fruit and vegetable export industry still faces significant challenges in preservation, transportation, and meeting international standards. Strong investments in processing technology, improving product quality, and optimizing logistics will be key to maintaining and expanding market share in demanding markets like the EU and the United States. The outlook for Vietnam’s fruit and vegetable sector is highly promising, especially as free trade agreements continue to open up more opportunities for domestic businesses.

Read more: Vietnam’s fruit and vegetable exports: Key markets, challenges, and opportunities

October 6, 2024 0 comment
0 FacebookTwitterLinkedinWhatsapp
Vietnam Export Data

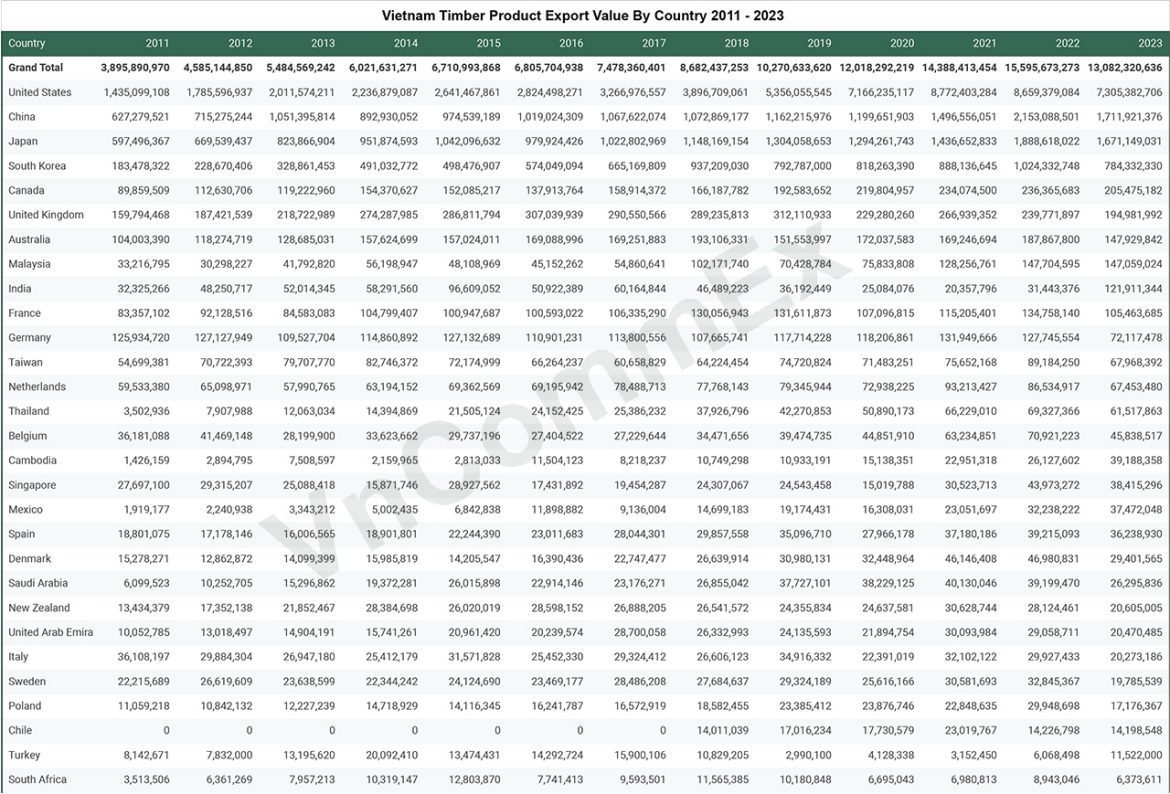
Vietnam Timber Product Export Value 2011 – 2025 (October Updated)

by Henry Truong October 6, 2024
written by Henry Truong

Vietnam Timber Product Export Value 2011 – 2025 (October Updated)

  • Raw data from the General Department of Vietnam Customs
  • Unit: USD Millions
Country2011201220132014201520162017201820192020202120222023202410M 2025Oct-25
Grand Total3895.894585.145484.576021.636710.996805.77478.368682.4410270.6312018.2914388.4115595.6713082.3215599.5

14039.34

1533.65

United States1435.11785.62011.572236.882641.472824.53266.983896.715356.067166.248772.48659.387305.389062.587804.91837.8
China627.28715.281051.4892.93974.541019.021067.621072.871162.221199.651496.562153.091711.922015.781609.37199.7
Japan597.5669.54823.87951.871042.1979.921022.81148.171304.061294.261436.651888.621671.151745.611772.81206.55
South Korea183.48228.67328.86491.03498.48574.05665.17937.21792.79818.26888.141024.33784.33807.49592.0253.14
Canada89.86112.63119.22154.37152.09137.91158.91166.19192.58219.8234.07236.37205.48251.67235.426.92
United Kingdom159.79187.42218.72274.29286.81307.04290.55289.24312.11229.28266.94239.77194.98224.2198.6920.73
Australia104118.27128.69157.62157.02169.09169.25193.11151.55172.04169.25187.87147.93160.45134.3117.31
Malaysia33.2230.341.7956.248.1145.1554.86102.1770.4375.83128.26147.7147.06155.61136.8313.35
India32.3348.2552.0158.2996.6150.9260.1646.4936.1925.0820.3631.44121.91208.7797.386.07
France83.3692.1384.58104.8100.95100.59106.34130.06131.61107.1115.21134.76105.46119.7484.5810.83
Germany125.93127.13109.53114.86127.13110.9113.8107.67117.71118.21131.95127.7572.1293.0276.711.92
Taiwan54.770.7279.7182.7572.1766.2660.6664.2274.7271.4875.6589.1867.9767.2952.013.96
Netherlands59.5365.157.9963.1969.3669.278.4977.7779.3572.9493.2186.5367.4579.1882.918.77
Thailand3.57.9112.0614.3921.5124.1525.3937.9342.2750.8966.2369.3361.5275.4868.688.36
Belgium36.1841.4728.233.6229.7427.427.2334.4739.4744.8563.2370.9245.8458.1548.585.11
Cambodia1.432.897.512.162.8111.58.2210.7510.9315.1422.9526.1339.1957.3858.338.6
Singapore27.729.3225.0915.8728.9317.4319.4524.3124.5415.0230.5243.9738.4239.1534.62.72
Mexico1.922.243.3456.8411.99.1414.719.1716.3123.0532.2437.4748.5156.628.14
Spain18.817.1816.0118.922.2423.0128.0429.8635.127.9737.1839.2236.2462.960.084.78
Denmark15.2812.8614.115.9914.2116.3922.7526.6430.9832.4546.1546.9829.435.9426.623.24
Saudi Arabia6.110.2515.319.3726.0222.9123.1826.8637.7338.2340.1339.226.334.4140.853.63
New Zealand13.4317.3521.8528.3826.0228.626.8926.5424.3624.6430.6328.1220.6122.2725.691.89
UAE10.0513.0214.915.7420.9620.2428.726.3324.1421.8930.0929.0620.4739.3530.382.62
Italy36.1129.8826.9525.4131.5725.4529.3226.6134.9222.3932.129.9320.2720.5417.692.83
Sweden22.2226.6223.6422.3424.1223.4728.4927.6829.3225.6230.5832.8519.7923.2923.463.25
Poland11.0610.8412.2314.7214.1216.2416.5718.5823.3923.8822.8529.9517.1827.6627.743.16
Chile000000014.0117.0217.7323.0214.2314.211.439.160.35
Turkey8.147.8313.220.0913.4714.2915.910.832.994.133.156.0711.523.915.081.01
South Africa3.516.367.9610.3212.87.749.5911.5710.186.76.988.946.378.226.910.38
Laos000000047.0846.8824.418.985.576.189.394.471.25
Hong Kong44.1245.1990.5677.52114.5633.4117.197.714.289.854.325.084.52.921.620.11
Norway7.9610.838.939.317.574.575.434.443.882.132.972.74.12.852.280.24
Portugal2.861.781.882.322.462.542.992.43.222.353.535.793.743.727.420.52
Russia6.298.697.987.244.092.763.835.135.156.817.693.973.54.993.330.1
Kuwait4.43.064.476.959.118.689.5267.575.938.043.183.434.31.70.21
Greece4.973.072.583.224.163.523.712.893.852.32.563.282.933.632.30.13
Finland6.664.364.23.892.962.031.232.051.611.161.41.71.71.241.060.17
Switzerland4.674.693.852.861.431.2101.991.772.317.427.751.62.290.560.23
Czech Republic3.023.193.782.60001.972.741.442.541.771.591.631.780.18
Austria7.1510.626.064.292.431.6801.271.81.591.460.971.132.571.780.35
Hungary1.161.2600000000000000
Ukraine1.131.3500000000000000
October 6, 2024 0 comment
0 FacebookTwitterLinkedinWhatsapp
Garment & FootwearVietnam Export Data

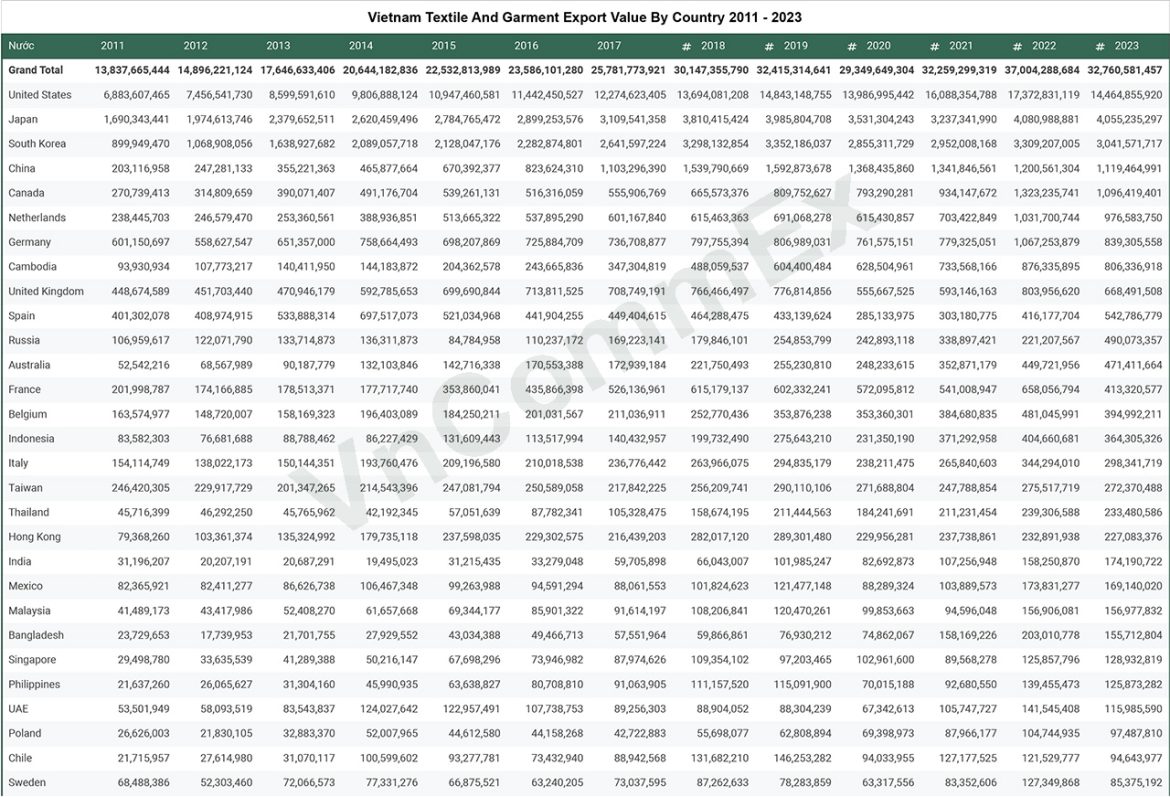
Vietnam Textile And Garment Export Value 2011 – 2025

by Henry Truong October 5, 2024
written by Henry Truong

Vietnam Textile & Garment Export Value 2011 – 2025 (October updated)

  • Raw data from the General Department of Vietnam Customs
  • Unit: USD Millions
Country2011201220132014201520162017201820192020202120222023202410M 2025Oct 2025
Grand Total13837.6714896.2217646.6320644.1822532.8123586.125781.7730147.3632415.3129349.6532259.337004.2932760.5836527.77

32931.98

3178.9

United States6883.617456.548599.599806.8910947.4611442.4512274.6213694.0814843.151398716088.3517372.8314464.8616152.714811.831323.08
Japan1690.341974.612379.652620.462784.772899.253109.543810.423985.83531.33237.344080.994055.244329.253805.82441.85
South Korea899.951068.911638.932089.062128.052282.872641.63298.133352.192855.312952.013309.213041.573149.352525.89258.26
China203.12247.28355.22465.88670.39823.621103.31539.791592.871368.441341.851200.561119.461326.521150.3999.63
Canada270.74314.81390.07491.18539.26516.32555.91665.57809.75793.29934.151323.241096.421211.31037.56102.9
Netherlands238.45246.58253.36388.94513.67537.9601.17615.46691.07615.43703.421031.7976.581224.571110.75129.13
Germany601.15558.63651.36758.66698.21725.88736.71797.76806.99761.58779.331067.25839.31795.45736.5473.93
Cambodia93.93107.77140.41144.18204.36243.67347.3488.06604.4628.5733.57876.34806.34888.24760.9373.39
United Kingdom448.67451.7470.95592.79699.69713.81708.75766.47776.81555.67593.15803.96668.49765.31737.0672.96
Spain401.3408.97533.89697.52521.03441.9449.4464.29433.14285.13303.18416.18542.79607.83542.6144.27
Russia106.96122.07133.71136.3184.78110.24169.22179.85254.85242.89338.9221.21490.07762.77464.3914.31
Australia52.5468.5790.19132.1142.72170.55172.94221.75255.23248.23352.87449.72471.41569.92494.1245.47
France202174.17178.51177.72353.86435.87526.14615.18602.33572.1541.01658.06413.32499.3428.2844.2
Belgium163.57148.72158.17196.4184.25201.03211.04252.77353.88353.36384.68481.05394.99410.83377.6635.54
Indonesia83.5876.6888.7986.23131.61113.52140.43199.73275.64231.35371.29404.66364.31452.14416.6642.68
Italy154.11138.02150.14193.76209.2210.02236.78263.97294.84238.21265.84344.29298.34338.88327.6230.22
Taiwan246.42229.92201.35214.54247.08250.59217.84256.21290.11271.69247.79275.52272.37277.99210.4523.73
Thailand45.7246.2945.7742.1957.0587.78105.33158.67211.44184.24211.23239.31233.48289234.3422.42
Hong Kong79.37103.36135.32179.74237.6229.3216.44282.02289.3229.96237.74232.89227.08262.67240.9223.09
India31.220.2120.6919.531.2233.2859.7166.04101.9982.69107.26158.25174.19179.35174.4418.79
Mexico82.3782.4186.63106.4799.2694.5988.06101.82121.4888.29103.89173.83169.14217.49185.4620.35
Malaysia41.4943.4252.4161.6669.3485.991.61108.21120.4799.8594.6156.91156.98166.9136.1215.8
Bangladesh23.7317.7421.727.9343.0349.4757.5559.8776.9374.86158.17203.01155.71193.75166.2417.29
Singapore29.533.6441.2950.2267.773.9587.97109.3597.2102.9689.57125.86128.93122.9680.1811.17
Philippines21.6426.0731.345.9963.6480.7191.06111.16115.0970.0292.68139.46125.87138.24111.3116.71
UAE53.558.0983.54124.03122.96107.7489.2688.988.367.34105.75141.55115.99158.45122.0817.74
Poland26.6321.8332.8852.0144.6144.1642.7255.762.8169.487.97104.7497.49118.38133.0611.95
Chile21.7227.6131.07100.693.2873.4388.94131.68146.2594.03127.18121.5394.6473.9979.689.46
Sweden68.4952.372.0777.3366.8863.2473.0487.2678.2863.3283.35127.3585.38103.97128.2513.32
Brazil32.6941.8254.0369.2367.5241.6947.0853.7660.7848.242.4562.0666.5770.7959.797.14
Denmark102.91114.3291.3689.1275.3576.0477.3496.1679.0454.5857.0898.2258.0267.7648.554.48
Saudi Arabia47.4364.5659.7153.9356.8849.0945.8144.4750.2130.7527.7940.5657.5443.2440.335.15
Turkey108.8268.4463.8666.6938.0229.7741.1144.0933.1738.7938.4369.4747.8151.5845.794.85
Sri Lanka000000026.5542.7340.2158.1350.147.4847.4543.164.73
New Zealand7.93812.8217.2415.516.3519.4122.2828.7227.736.0342.6543.8955.546.955.08
Myanmar3.245.6513.1713.1411.9112.0916.4326.5234.7231.3333.5854.9137.832.1526.831.94
Kenya00000005.1310.9428.2515.1231.5630.2611.4717.330.74
South Africa20.7815.3918.1221.0720.1319.8824.227.0728.820.121.4131.7428.6631.7927.773.5
Israel7.8214.1315.5714.2614.2915.2617.7821.6122.4722.3725.232.7528.3741.2737.773.16
Panama2335.0534.8621.0728.1323.6417.5620.6519.3615.416.3226.724.6924.0138.034.91
Czech Republic38.4933.3627.1415.1510.789.049.2213.4512.4212.6813.1413.4821.5531.0919.93.16
Argentina23.2416.8617.4615.0922.9122.9229.4224.7819.0510.6810.6818.8817.7320.2932.425.47
Nigeria03.8219.6815.877.278.349.310.5430.1540.3546.3626.2416.4131.9829.321.64
Mozambique000000013.956.527.89.890.3415.9416.157.673.02
Norway14.7812.4321.8221.3923.0725.8721.2825.0222.8414.9917.5524.2115.2910.8911.251.15
Colombia000000012.714.4510.8413.822.213.9421.5428.334.5
Peru00000008.4810.498.119.312.6712.913.3614.231.46
Ivory Coast1.041.88017.85002.175.822.1816.580.450.4412.811.191.580
Austria30.0727.8527.1117.0520.1526.7736.842.1935.7722.559.6411.312.2413.8611.321.12
Egypt9.029.555.235.254.84.364.856.717.176.869.9611.049.5316.3510.11.17
Finland12.437.5412.1515.6110.129.77.8914.7714.3410.1110.4711.939.429.164.540.63
Tanzania000000015.4620.284.6811.4514.868.772.814.980.59
Laos6.036.927.7106.997.885.976.88.067.8310.8710.977.936.954.481.01
Switzerland15.114.1113.5713.4310.812.0310.5211.713.5711.959.3411.847.3911.49.481.18
Greece8.528.438.166.526.938.539.867.818.265.883.688.156.626.543.150.15
Ghana7.043.753.290.625.864.788.426.334.5510.716.945.164.1312.416.720.83
Luxembourg00000004.126.988.638.755.273.757.236.41.01
Ukraine18.1721.0212.126.43.884.753.774.115.396.086.542.713.28.888.050.9
Slovakia16.2113.5412.574.613.672.871.711.161.0101.051.893.115.234.830.21
Angola7.414.517.2112.294.146.6715.9524.9126.266.623.044.323.0161.990.15
Senegal00014.135.364.751.464.850.9105.743.2827.231.521.51
Hungary9.716.378.966.891.4302.073.231.131.611.010.951.082.710.610

See more:

  • Vietnam Toys, Sporting Goods and Parts Export Value 2015 – 2025
  • Vietnam Footwear Export Value 2011 – 2025
October 5, 2024 0 comment
0 FacebookTwitterLinkedinWhatsapp
Newer Posts
Older Posts

Recent Posts

  • Import Vietnamese Coffee: Your Strategic B2B Playbook
  • Vietnam’s Coffee Economy: Market Trends, Export, and Sustainable Future
  • Vietnamese Coffee Brands: Your Definitive Guide to Authentic Flavors, Top Picks & Smart Buying
  • Vietnamese Coffee Taste: Your Sensory Guide to Bold Flavors
  • Vietnamese Coffee: Ultimate Guide to History, Brews & Global Impact

Follow Us

Facebook Linkedin Twitter

Recent Posts

  • Import Vietnamese Coffee: Your Strategic B2B Playbook

    December 17, 2025
  • Vietnam’s Coffee Economy: Market Trends, Export, and Sustainable Future

    December 15, 2025
  • Vietnamese Coffee Brands: Your Definitive Guide to Authentic Flavors, Top Picks & Smart Buying

    December 13, 2025
  • Vietnamese Coffee Taste: Your Sensory Guide to Bold Flavors

    December 12, 2025
  • Vietnamese Coffee: Ultimate Guide to History, Brews & Global Impact

    December 11, 2025

Categories

  • Food & Spicy Industry (30)
  • Free Trade Agreement (18)
  • Fruit & Vegetable (56)
  • Garment & Footwear (11)
  • Market Insights (29)
  • Others (4)
  • Seafood (4)
  • Vietnam Commodity Market Price (17)
  • Vietnam Export Data (15)
  • Vietnam Market (6)
  • Wood & Furniture (19)

Vietnam Commodity Export offers comprehensive and in-depth information on Vietnam’s sourcing market, highlighting opportunities and challenges across various industries. We help international businesses find quality manufacturers and reliable suppliers in Vietnam, providing the critical insights needed to connect with the best partners and resources in the market.

Newsletter Subscribe
    • Homepage
    • Market Insight
    • Sourcing Service
    • Vietnam Overview
    • Publication
    • About Us
    • Contact Us
  • Product Catalogue
    • Coconut Products
    • Tropical Fruits
    • Spicy Products
    • Food & Nuts Products
    • Dried Fruit

You are looking for suppliers in Vietnam!

Shop Now
Facebook Linkedin Twitter Email
VNCOMMEX Group Co. Ltd Address: 06 Vo Van Kiet, Nguyen Thai Binh Ward, District 1, HCMC
Email: info@vncommex.com

All rights reserved. Designed and developed by Vietnam Commodity Exports

Privacy Policy

FAQ

VnCommEx
  • VCE
  • Product Catalogue
  • Market Insight
    • Wood & Furniture
    • Garment & Footwear
    • Food & Spicy Industry
    • Fruit & Vegetable
    • Others
    • Market Insights
  • Vietnam Market
    • Vietnam Commodity Market Price
    • Vietnam Export Data
    • Vietnam in FTA
  • Publication
  • About Us
  • English
    • 中文 (中国)
    • Tiếng Việt
VnCommEx
  • VCE
  • Product Catalogue
  • Market Insight
    • Wood & Furniture
    • Garment & Footwear
    • Food & Spicy Industry
    • Fruit & Vegetable
    • Others
    • Market Insights
  • Vietnam Market
    • Vietnam Commodity Market Price
    • Vietnam Export Data
    • Vietnam in FTA
  • Publication
  • About Us
  • English
    • 中文 (中国)
    • Tiếng Việt
@2021 - All Right Reserved. Designed and Developed by PenciDesign
✕

Shopping Cart

Close
No products in the cart.
Close
 
Return to shop