VnCommEx
Hợp tác xuất khẩu SUBSCRIBE
VnCommEx
Hợp tác xuất khẩu SUBSCRIBE
  • VCE
  • Product Catalogue
  • Market Insight
    • Wood & Furniture
    • Garment & Footwear
    • Food & Spicy Industry
    • Fruit & Vegetable
    • Others
    • Market Insights
  • Vietnam Market
    • Vietnam Commodity Market Price
    • Vietnam Export Data
    • Vietnam in FTA
  • Publication
  • About Us
  • English
    • 中文 (中国)
    • Tiếng Việt
VnCommEx
VnCommEx
  • VCE
  • Product Catalogue
  • Market Insight
    • Wood & Furniture
    • Garment & Footwear
    • Food & Spicy Industry
    • Fruit & Vegetable
    • Others
    • Market Insights
  • Vietnam Market
    • Vietnam Commodity Market Price
    • Vietnam Export Data
    • Vietnam in FTA
  • Publication
  • About Us
  • English
    • 中文 (中国)
    • Tiếng Việt
All Right Reserved. Designed and Developed by PenciDesign
Market Insights

Restructuring Global Supply Chains in the Shadow of Geopolitics (Part 2)

by Henry Truong August 29, 2025
written by Henry Truong

Part 1 here: Restructuring Global Supply Chains in the Shadow of Geopolitics (Part 1)

How are geopolitical shifts impacting the energy supply chain?

Geopolitical shifts are profoundly impacting the energy supply chain by transitioning its focus from traditional oil dependence to critical minerals essential for renewable energy. Historically, the global energy market relied heavily on geopolitically unstable regions like the Middle East and vulnerable maritime chokepoints, where organizations such as OPEC could directly influence supply and prices, as seen with the 2022 production cut that drove Brent crude above $120 per barrel. Critical straits, including Bab el-Mandeb, which sees over 6.2 million barrels of oil pass daily, are also frequently at risk from regional conflicts.

A major geopolitical shift is underway: from controlling oil to controlling the critical minerals essential for renewable energy, such as lithium, cobalt, and rare earth elements. In 2022, the Democratic Republic of Congo supplied over 70% of global cobalt production, while China controlled more than 60% of lithium refining capacity and 85% of rare earth processing capacity. This has created a new layer of dependency for Western nations.

The battle for supply control has shifted focus: once it was oil fields, now it is mineral mines for electric vehicle batteries, solar panels, and wind turbines. Lithium carbonate prices surged nearly 500% between 2020 and late 2022, fueling a “mining rush” in South America and Australia. Similarly, China’s 2023 decision to tighten exports of gallium and germanium—two strategic materials for semiconductors and green energy—created a significant supply gap, forcing the U.S., EU, and Japan to accelerate mining investments in Africa and South America.

This underscores that the renewable energy supply chain, once viewed as a sustainable solution, is facing geopolitical risks comparable to those of traditional fossil fuel supply chains.

What is ‘chip diplomacy’ and how does it affect the semiconductor industry?

Chip diplomacy refers to strategic efforts by nations, particularly the U.S., to secure and diversify the highly complex and sensitive semiconductor supply chain, which is currently heavily reliant on a small number of countries and regions. Taiwan’s TSMC, for instance, produces approximately 90% of the world’s advanced chips under 10 nanometers, establishing the island as a critical global strategic chokepoint. This concentration means that any disruption, whether from natural disasters or military tensions, could severely impact global automotive, electronics, and defense industries, making diplomatic strategies crucial for national security.

To mitigate these risks, the U.S. passed the CHIPS and Science Act in 2022, providing over $52 billion in subsidies to encourage companies like Intel, TSMC, and Samsung to build fabs in Texas, Arizona, and New York. At the same time, a strategy of “chip diplomacy” is being pursued to develop a trusted international partner network: Vietnam, Malaysia, and Costa Rica are emerging as assembly and testing (OSAT) hubs to partially replace China.

On the other hand, China is rapidly advancing its technological self-reliance. Despite restrictions on access to sub-7nm technology, SMIC managed to produce 7nm chips for Huawei’s Mate 60 Pro in 2023, raising concerns in the U.S. and allied nations about loopholes in export controls. The earlier sanctions on Huawei had already demonstrated the power of technology restrictions: within just two years, Huawei’s global smartphone market share plunged from 18% (2019) to below 5% (2021).

Why is China still central to global supply chains despite de-risking efforts?

Despite being at the heart of geopolitical tensions and global de-risking efforts, China remains an irreplaceable link in global supply chains due to its extensive control over critical manufacturing and processing capacities. For example, China controls over 70% of global lithium-ion battery manufacturing capacity (IEA, 2023) and more than 80% of cobalt refining, both essential for EV batteries. Furthermore, it dominates the rare earths sector, accounting for approximately 60% of mining output and nearly 90% of processing capacity (USGS, 2022).

In logistics, 7 of the world’s 10 busiest container ports are located in China, led by Shanghai, which handled over 47 million TEUs in 2022—almost double the throughput of the largest U.S. port (Los Angeles). This massive logistics capacity makes China the “logistics infrastructure” of global trade.

This poses a major challenge to Western “de-risking” and friendshoring strategies. While the U.S. and Europe are ramping up domestic battery projects (e.g., Northvolt’s gigafactory in Sweden or Tesla’s plant in Germany), experts estimate it will take at least 5–10 years to build capacity competitive with China. In the short term, a complete substitution is virtually impossible. As a result, supply chain restructuring will be a costly and prolonged process, with reshoring or nearshoring offering only limited relief. In practice, many multinationals are adopting a “China+1” strategy—maintaining production in China while diversifying into countries such as Vietnam, India, or Mexico to reduce risks.

Conclusion

These two articles have highlighted that global supply chains are undergoing an unprecedented phase of transformation, driven by the dual forces of geopolitical conflict and the urgent push toward sustainability. From energy and semiconductors to other strategic sectors, supply chain security is no longer merely a corporate issue but a top national priority.

Yet, the reality is that restructuring cannot happen overnight. China continues to hold a pivotal role across production, processing, and logistics, making the path to reduced dependency a long, costly, and complex journey. In this context, strategies such as “China+1,” friendshoring, and trusted partnership networks represent temporary measures—balancing sustainability with cost-efficiency.

The future of global supply chains will hinge on the adaptability of both governments and businesses: can they maintain flexibility, safeguard strategic security, and still optimize costs? This will be the central question shaping global trade and the world economy in the decade ahead.

Read more:
  • Restructuring Global Supply Chains in the Shadow of Geopolitics (Part 1)
  • How long can Vietnam maintain its dominance in the cashew industry?
  • The 50% Coffee Tariff and the Future of Global Supply
August 29, 2025 0 comment
0 FacebookTwitterLinkedinWhatsapp
Food & Spicy Industry

Coffee Market Analysis Week 18-24/8/2025: Perfect Storm of Prices and Geopolitical Shifts

by Henry Truong August 25, 2025
written by Henry Truong

The surge underscores two forces: tightening supply from major producers like Vietnam and Brazil, and shifting trade flows shaped by global political risk.

On ICE Futures Europe (London), Robusta hit a three-month high. The November 2025 contract rose $583/ton week-on-week. More striking, the September delivery contract spiked from $4,201/ton to $4,866/ton in just seven days.

On ICE Futures US (New York), Arabica mirrored the rally. The December 2025 contract leapt 44 cents/pound, while September delivery climbed from 341.65 to 390.65 cents/pound. The surge confirmed that market heat is not confined to Robusta; Arabica is now equally exposed.

This rare dual surge highlights the fragility of global coffee supply chains and signals higher volatility ahead for both producers and consumers.

What Caused the Global Coffee Price Surge in August 2025?

The unprecedented surge in global coffee prices during August 2025 was not a random event but the result of four powerful, converging forces. At the core of this market upheaval was a new U.S. tariff policy, which acted as the primary trigger, setting off a chain reaction across the global coffee supply chain.

1. The U.S. 50% Import Tariff on Brazilian Coffee: The Supply Chain Shock

Impact Level: ⭐⭐⭐⭐⭐ (Very High)

In early August 2025, the U.S. imposed a sudden 50% tariff on coffee imports from Brazil, the world’s largest producer. Brazil accounts for 37% of global output and supplies about one-third of U.S. imports. Overnight, Brazilian coffee became economically unviable for many U.S. buyers, forcing widespread contract delays and cancellations.

This sparked a race for an alternative supply. U.S. roasters and importers rushed to source from Colombia, Peru, and Ethiopia, driving up local prices and feeding into global benchmarks. The initial costs fell on importers, but the burden is already shifting to consumers: U.S. retail coffee prices are up 14.5%, with small cafés warning of hikes between 18–25%.

Meanwhile, the geopolitical chessboard shifted. China signed a five-year deal with 183 Brazilian exporters, redirecting volumes once destined for the U.S. This move not only restructured global coffee trade flows but also reduced U.S. influence in price formation, amplifying the volatility across both Robusta and Arabica markets.

2. Frost in Brazil: A Natural Threat

Impact Level: ⭐⭐⭐⭐ (High)

Extreme weather added fresh pressure to supply. Late-winter frosts in southeastern Brazil, especially in Cerrado Mineiro, raised fears of crop damage for the 2025/26 harvest. Early forecasts suggest a 5.5% drop in Brazil’s coffee output, deepening concerns over future shortages. Investors responded quickly, accelerating buying on futures exchanges as a hedge against weather risk.

3. Record-Low Stocks and Declining Exports: A Tight Supply Picture

Impact Level: ⭐⭐⭐⭐ (High)

Coffee inventories on ICE exchanges fell to record lows in both Arabica and Robusta, signalling an acute supply squeeze. This structural shortfall is expected to sustain long-term upward pressure on prices.

Brazilian export data confirms the strain: in July 2025, shipments totaled 2.45 million bags of green coffee, down 28.1% year-on-year. While multiple factors may explain the drop, the signal is clear—supply from the world’s top exporter is tightening, reinforcing the bullish momentum.

4. Weakening USD and Fed Rate Cut Expectations: Macro Tailwinds

Impact Level: ⭐⭐⭐ (Moderate)

Macro conditions amplified the rally. The U.S. dollar weakened sharply, while markets priced in a potential Federal Reserve rate cut in September 2025. For investors holding other currencies, USD-denominated commodities like coffee became more attractive, fueling additional speculative demand. Though not the main driver, these macro shifts acted as a catalyst for an already overheated market.

How Did Vietnam’s Coffee Market React to Global Price Changes?

The trading week of 18–24 August 2025 marked a dramatic breakthrough in Vietnam’s domestic coffee market. Prices surged to historic highs, signalling both bullish momentum and deeper macro uncertainties.

Impressive Price Surge:  At the start of the week, domestic prices stood at 116,800–117,500 VND/kg, already elevated after strong gains the week before, when Dak Lak averages hit 109,013 VND/kg (up 7.6% week-on-week). The rally accelerated on August 21, with prices jumping 6,000–6,100 VND/kg in a single session, reaching a weekly peak of 123,000–123,900 VND/kg. By week’s end, levels held firm at 123,500–124,000 VND/kg, reflecting strong confidence and speculative demand.

Drivers Behind the Price Shock

  1. Inventory–Price Discrepancy: A Risk Premium Effect: Despite surging prices, fundamentals painted a different picture. Global Robusta inventories rose 5.99% in June 2025, reaching 3.2 million bags. Meanwhile, Vietnam’s 2025/26 output is forecast to expand sharply to nearly 2 million tons. The divergence suggests that markets are not reacting to present supply, but rather pricing in future risks. This “risk premium” explains why prices stayed strong despite no immediate evidence of physical shortage.
  2. Exchange Rate Pressures: Macro Linkages at Play: Currency shifts also fed the rally. A stronger U.S. dollar (USD) against the Vietnamese dong (VND) made Vietnamese exports more competitive. The USD/VND rate climbed from 26,040 (August 11) to 26,080 (August 18), incentivising exporters to bid higher in domestic markets to secure supply for international buyers. This FX-driven demand provided another upward push to already overheated prices.

Vietnam Domestic Coffee Prices by Day (August 18–24, 2025)

Unit: VND/Kg

What’s the Coffee Market Forecast for August 25–31, 2025?

Looking ahead to the week of August 25–31, 2025, experts anticipate that both global and Vietnamese coffee prices will likely extend their current bullish momentum. However, despite the strong upward trend, the possibility of short-term technical corrections due to profit-taking or other market dynamics remains a key consideration for traders and producers.

Robusta Market
Robusta prices are poised to challenge the $4,800/ton resistance level. If breached, futures could test the $5,000/ton mark. However, after last week’s sharp rally, the risk of profit-taking by speculators is high, which may trigger a short-term technical correction.

Arabica Market
Arabica futures are projected to climb further, targeting 400–410 cents/pound. The main drivers remain:

  • Brazil’s low production cycle and adverse weather conditions are raising supply concerns.
  • A weaker U.S. dollar and expectations of Federal Reserve policy easing, which encourage speculative inflows.

Unless the U.S. government revises its new tariff policy, many analysts believe Arabica could return to its previous peak levels, pulling Robusta prices higher in tandem.

Vietnam Domestic Market
Domestic prices in Vietnam will continue to track Robusta trends on the London exchange. With end-of-season supply running low and farmers holding back stocks, prices remain strongly supported. A move above 125,000 VND/kg is possible this week, though trading volumes will likely stay limited due to tight supply.

See more: Coffee Week 11-18/8/2025: Strong Breakthrough, Reaching Record Peaks

August 25, 2025 0 comment
0 FacebookTwitterLinkedinWhatsapp
Market Insights

Restructuring Global Supply Chains in the Shadow of Geopolitics (Part 1)

by Henry Truong August 22, 2025
written by Henry Truong

Military conflicts and trade tensions are inflicting substantial economic damage, estimated at up to $14.5 trillion globally over five years. Their impacts extend far beyond simple transport disruptions or rising costs, triggering a chain reaction of inflation, raw material shortages, and heightened uncertainty. In response, businesses are proactively diversifying their supply chains, investing in new technologies, and building reliable partner networks. In this context, “third countries” such as Vietnam are presented with opportunities to become key nodes in the emerging supply chain landscape, but they also face internal challenges such as high logistics costs and underdeveloped infrastructure.

How did global supply chains become so fragile?

The second half of the 20th century witnessed a remarkable boom in global trade, with trade as a share of world GDP climbing to a record 61% in 2007 (compared to only about 25% in the early 1970s). The just-in-time (JIT) supply chain model became the foundation, enabling firms to minimise costs by relocating production to low-wage economies such as China, Vietnam, and Mexico while keeping inventories lean. This system thrived as long as trade routes remained open and stable—for instance, containerised shipping across the Pacific grew fivefold between 1980 and 2010.

Yet this very dependence on a small set of suppliers and routes created fragility: the 2011 Tohoku tsunami crippled global automotive and semiconductor supply chains for months; the Ever Given blockage in the Suez Canal in 2021 disrupted 12% of global trade for just a few days, inflicting an estimated $9–10 billion in losses per day.

See further: The History of Global Sourcing and the World’s Largest Sourcing Hubs

This chart illustrates the volatility of GDP growth over the following periods: post-war period, oil crisis, recovery, to the 2008–2009 financial crisis.

This graph illustrates geo-economic movements: the decline of China and India in the 19th century, followed by their resurgence in the late 20th century.

What were the first major disruptions to global supply chains?

The end of borderless globalisation began with the Global Financial Crisis (2008–2009), when world trade volumes collapsed by 12% in 2009 alone—the steepest drop since World War II. From then on, trade growth no longer outpaced GDP as it once had.

Next came the U.S.–China trade war (2018–2019): the U.S. imposed tariffs on over $370 billion worth of Chinese goods, while China retaliated with tariffs on about $110 billion in U.S. exports. Some third economies benefited—Vietnam’s exports to the U.S. jumped 35.6% in 2019, fueled by supply chain shifts from China.

The most devastating shock was COVID-19 (2020–2021), which froze supply chains worldwide: global auto output plunged 16% in 2020, while a semiconductor crunch paralysed industries as demand soared, but production was disrupted. Scenes of container backlogs at Los Angeles and Shanghai, or shortages of masks and medicines in developed countries, exposed dangerous overreliance on a handful of suppliers and the lack of resilience in global systems.

See more: Shipping Crisis – How U.S.–China Rivalry Is Reshaping Global Logistics

How are current geopolitical conflicts reshaping global supply chains?

Even as the world began to recover from the pandemic, new geopolitical conflicts worsened the fragility. The Russia–Ukraine war (since 2022) disrupted more than 30% of global wheat supply and sent European natural gas prices soaring fivefold in 2022, pushing eurozone inflation to a 40-year high. In the Middle East, Houthi attacks on shipping in the Red Sea (2023–2024) slashed Suez Canal traffic—normally 12% of world trade—by over 40% in early 2024, forcing reroutes around the Cape of Good Hope and inflating costs and transit times by double-digit percentages.

The WTI crude oil price chart over the past decade vividly reflects these shocks: collapsing below $0 in early 2020, then surging above $120 per barrel in 2022 as demand recovered and geopolitical tensions escalated.

These events are not isolated causes, but accelerants of a restructuring process already underway. The cumulative shocks—financial crisis, trade war, pandemic, and now armed conflicts—have shifted perceptions of risk: from “acts of God” to systemic and persistent threats.

What are the economic impacts of these supply chain disruptions?

The ripple effects are global. Lloyd’s of London (2023) estimates that a hypothetical geopolitical conflict could wipe out $14.5 trillion in global GDP over five years—roughly 7% of world output.

At the macro level, energy disruptions pushed Brent crude above $120/barrel in mid-2022, while European gas prices soared 5x their 2019 average. Shipping costs skyrocketed: the Drewry World Container Index hit a record $10,300 per 40ft container in Sept 2021, nearly seven times pre-pandemic averages.

At the micro level, production costs surged, fueling global inflation to 8.8% in 2022 (IMF)—the highest in decades. Indirect risks also mounted: congestion at Los Angeles and Shanghai ports stretched lead times by 20–30 days, while tighter customs procedures and mandatory stockpiling pushed warehouse costs in the U.S. and EU up 25–30% between 2021–2023.

What new strategies are businesses using to manage supply chain risks?

To adapt, firms are embracing new supply chain strategies:

  • Reshoring: Bringing production back home.
  • Nearshoring: Moving production closer geographically.
  • Friendshoring: Relocating to allied nations with shared political/economic values to mitigate geopolitical risks.
  • Onshoring: Keeping production domestic from the outset.

Each approach has trade-offs. Reshoring boosts quality control and domestic jobs but raises costs. Nearshoring blends cost savings with proximity—IBM’s shift from the U.S. to Mexico is a prime example. Friendshoring enhances political security but may reduce competitiveness if partners lack cost or technological advantages.

This is more than a geographic shift—it is a philosophical transformation. Where low labour cost once dictated location, the new priority is minimising risk and building resilience, even at higher costs. The rise of friendshoring—selecting partners based on shared political, economic, or even military values rather than just price or quality—is perhaps the clearest manifestation of this shift.

See further: Global Sourcing Trends – Current and Future

Table 1: Comparison of Supply Chain Relocation Strategies

Conclusion

The past decade has shown that globalisation no longer guarantees smoothness and efficiency. Global supply chains have revealed deep vulnerabilities, from financial crises and pandemics to geopolitical conflicts. These consecutive shocks have transformed risks from localised disruptions into systemic threats, forcing businesses and policymakers to rethink production, trade flows, and risk governance.

Yet within this turbulence lies opportunity. A new wave of supply chain restructuring is taking shape: new production hubs, more flexible business models, and shifting flows of capital and technology are redrawing the map of global trade. Vietnam, with its rising role in global value chains, now has the chance to elevate its position—not merely as a low-cost manufacturing destination, but as a strategic node in the diversification strategies of multinational corporations.

In Part 2, we will explore:

  • The restructuring of critical industries: energy, semiconductors, and China’s central role.
  • Government and corporate responses to enhance resilience.

And finally, the opportunities and challenges for “third countries” like Vietnam in the emerging global supply chain landscape.

August 22, 2025 0 comment
0 FacebookTwitterLinkedinWhatsapp
Food & Spicy Industry

Coffee Week 11-18/8/2025: Strong Breakthrough, Reaching Record Peaks

by Henry Truong August 20, 2025
written by Henry Truong

How did Vietnam’s coffee market perform during this record-breaking week?

During the week of August 11-18, Vietnam’s domestic coffee market experienced a significant surge, reaching unprecedented price levels. While prices were stable at the beginning of the week, ranging from VND 103,500 to VND 104,000 per kilogram, with Dak Nong recording the highest at VND 104,000/kg, this stability quickly gave way to a rapid increase by week’s end.

By the end of the week, prices had exploded. On August 18, prices in key provinces reached these record levels:

  • Dak Nong: VND 117,500/kg (up 13.0%)
  • Dak Lak: VND 117,300/kg (up 13.0%)
  • Gia Lai: VND 117,200/kg (up 13.1%)
  • Lam Dong: VND 116,800/kg (up 12.8%)

The rapid price increase created a complex situation. High domestic prices prompted some warehouses to stop buying, a move that could slow Vietnam’s exports. This action, however, tightened global Robusta supply, which in turn contributed to the worldwide price increase. The intricate link between Vietnam’s domestic market and global trends shows that the actions of Vietnamese producers directly impact the global Robusta supply chain.

Why did global Robusta and Arabica coffee prices soar?

Global coffee prices for both Robusta and Arabica experienced significant gains during the week of August 11-18, 2025, primarily driven by a combination of market forces, supply chain disruptions, and increased speculative buying. This period saw both coffee varieties climb sharply, reflecting a dynamic and volatile market landscape.

Futures Market Performance

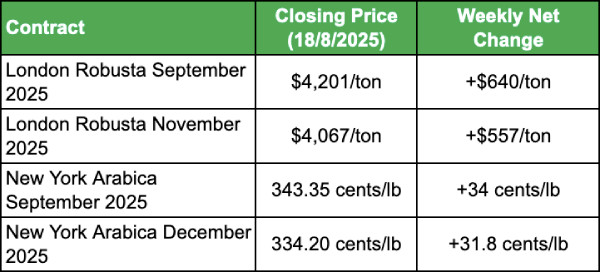
  • London Exchange (ICE Robusta): The September 2025 futures contract surged 18%, closing at $4,201 per ton. The November contract also rose sharply, up 15.9% to $4,067 per ton. This strong performance signals robust demand for Robusta coffee.
  • New York Exchange (ICE Arabica): Arabica prices followed a similar trajectory. The September 2025 contract increased 11%, reaching 343.35 US cents per pound. On August 15, the price hit a new high, nearly 40% above the same period last year.

Inventory and Price Signals: A Mixed Picture

While certified Arabica inventories on the New York exchange showed a slight increase, the number of lots waiting for inspection fell significantly. This suggests that new physical supplies are not entering the market quickly, possibly due to shipping delays. This discrepancy between rising inventory and a slowdown in new supplies points to a tightening market.

Another key factor is the widening price gap between Robusta and Arabica. This trend shows a stronger demand for Robusta, making its price discount less attractive to buyers. As a result, some buyers are likely shifting to the Arabica market, further contributing to its price increase.

Table 1: Main Coffee Futures Contract Prices (August 11-18, 2025)

Speculation Fuels Coffee Price Surge

The latest Commitment of Traders (COT) report highlights a clear shift in coffee market sentiment. During the week ending August 12, speculators and hedge funds made significant moves, betting on higher prices.

  • On the New York Arabica exchange, speculators boosted their net long positions by 4.09%. This move shows confidence in future price gains.
  • Meanwhile, on the London Robusta exchange, hedge funds slashed their net short positions by 27.38%. This indicates they are no longer betting on falling prices, but instead expect them to rise.

This collective optimism has driven the market’s recent rally. The price increase isn’t just a result of fundamental supply and demand; it is being actively pushed by speculative buying and short-covering. As a result, the market is highly sensitive to trader sentiment. A shift in macroeconomic factors or negative news could trigger a sharp correction.

How are major coffee exporters adapting to global market changes?

Major coffee-producing nations are currently navigating a complex and shifting global landscape, marked by both significant challenges and new opportunities. While some countries contend with trade disputes and adverse climate conditions impacting their yields, others are experiencing record-breaking production and export growth, requiring diverse strategies to adapt and thrive.

Brazil: Tariffs and Weather Create Headwinds

As the world’s largest coffee exporter, Brazil is grappling with significant challenges. Although its harvest is 94% complete, with Robusta nearing 96%, low rainfall in the key Arabica region of Minas Gerais raises concerns about future crop yields.

Adding to the pressure, the U.S. imposed a 50% tariff on Brazilian coffee on August 6, 2025. This move has disrupted traditional supply chains, forcing Brazil to find new markets in places like China and the EU. The tariff also translates to a 15-20% price increase for U.S. consumers. As a result, Brazil’s green coffee exports plummeted in July 2025, falling 28% year-over-year. Arabica exports were down 21%, and Robusta exports saw a sharp 49% drop.

Colombia: A Decade of Record Growth

In stark contrast to Brazil, Colombia is celebrating a record-breaking period for its coffee industry. In July 2025, production hit 1.37 million 60kg bags, the highest level in a decade and a 19% increase from the previous year. This surge was primarily due to unusual rains that delayed the main harvest into July.

Thanks to this abundant supply, Colombia’s coffee exports in July rose 12%, reaching 1.15 million bags. Over the past 12 months, total exports have grown to 13.1 million bags, up 14%. The value of exports also soared, increasing by a remarkable 83.2% to $2.69 billion in the first half of 2025, signalling a strong recovery for the sector.

Indonesia and India: Navigating Unique Challenges

Indonesia is enjoying one of its best coffee seasons in years, with production up 20% compared to 2024. However, a new law requiring a three-month freeze on 30% of funds for exports over $250,000 has increased logistics costs, posing a challenge for exporters.

Meanwhile, India is facing adverse weather, including high temperatures and heavy rains, which have impacted its crops. Despite these issues, the country’s coffee exports are projected to hit a record $1.816 billion for the 2024-25 fiscal year. Strong domestic demand, particularly for instant coffee, is expected to continue supporting the industry.

In summary, the global coffee landscape is in a state of flux. While some major producers face significant hurdles, others are capitalising on favourable conditions to expand their market share. These diverse challenges and successes are collectively reshaping the dynamics of the global coffee trade.

See further:

  • Global Coffee Market Analysis (August 4-11, 2025)
  • Coffee Market Week 1/7 – 7/7/2025: Vietnam Grows Strongly, Globally Welcomes Surplus Wave
August 20, 2025 0 comment
0 FacebookTwitterLinkedinWhatsapp
Food & Spicy Industry

The impact of Vietnam’s 2025 government policies on the cashew import-export industry

by Henry Truong August 19, 2025
written by Henry Truong

2025 marks a significant turning point for Vietnam’s economy, with a series of new policies and public investment projects aimed at boosting strong growth, particularly in the agricultural sector. As one of Vietnam’s key export industries, the cashew sector faces both major opportunities and challenges from this new wave of policies, which focus on three key pillars:

  • Upgrading Logistics Infrastructure: Investment in transportation and port infrastructure is expected to significantly reduce shipping costs—a long-standing bottleneck that has hampered the industry’s competitiveness.
  • Deep Processing Revolution: The push for advanced technology and deep processing aims to increase the added value of cashew products, reducing the industry’s reliance on raw exports.
  • Export Market Diversification: Enhanced trade promotion and market diversification efforts are intended to mitigate the risks associated with over-reliance on a few traditional markets.

Despite these promising prospects, the cashew industry faces significant hurdles. These include the risk of slow disbursement of public project funds, strict technical and tariff barriers in major markets like the EU and the US, and especially a heavy dependence (around 90%) on imported raw materials—a critical strategic weakness.

How will Vietnam’s 2024-2025 monetary policy affect the cashew industry?

Vietnam’s 2024-2025 monetary policy, set by the State Bank of Vietnam (SBV), is designed to foster macroeconomic stability and economic growth, directly impacting the cashew industry. This policy aims for an 8% GDP growth and inflation below 4%.

  • GDP Growth: 8%
  • Inflation Control: Below 4%

To achieve these goals, the SBV has implemented several adjustments. As of July 31, 2025, the average lending interest rate for new transactions has decreased to 6.5% per annum, making it easier for businesses to access capital. At the same time, preferential credit packages for the agricultural sector have been rolled out, helping businesses reduce production and investment costs.

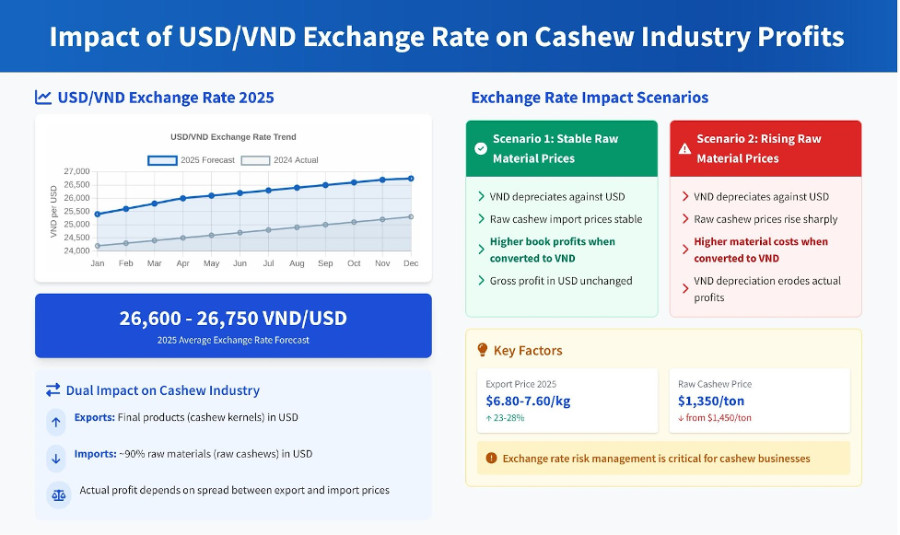
However, a key factor with complex and multifaceted effects on the cashew industry is the exchange rate. Cashew is a unique commodity: it exports the final product (cashew kernels) in USD while also importing the majority of its raw materials (raw cashews) in USD. Therefore, fluctuations in the USD/VND exchange rate are not just an export advantage but also create dual pressure on profitability.

How does the USD/VND exchange rate impact cashew business profitability?

The USD/VND exchange rate significantly influences the profitability of cashew businesses, especially given the industry’s unique position of both importing raw materials and exporting finished products in USD. A weakening Vietnamese Dong (VND), as observed with the reference exchange rate of 25,245 on August 18, 2025, and bank rates between 26,090 and 26,450, theoretically boosts export revenue when converted to VND, creating a ‘paper profit’.

However, since the cashew industry relies on imported raw materials for up to 90% of its needs, input costs also rise proportionally when converted to VND. Actual profitability depends on the difference between the export price of cashew kernels and the import cost of raw cashews.

Scenario 1: Stable Raw Material Prices

If the import price of raw cashews remains relatively stable, a depreciating VND could yield a certain level of paper profit for exporting businesses. The gross profit in USD would remain unchanged, but when converted to VND, it would be higher.

Scenario 2: Sharply Rising Raw Material Prices Not Aligned with Export Prices

This is the riskiest scenario. When the price of raw cashews increases significantly, the cost of raw materials to produce one ton of cashew kernels also rises. The depreciation of the VND would then amplify this cost when converted, eroding the business’s actual profit. In this case, the weakening VND is no longer an advantage but a factor that depletes profitability.

Therefore, cashew exporters need to manage exchange rate risks tightly. Strategic solutions like market diversification, supply chain optimisation, and investing in deep processing are crucial for the industry to overcome exchange rate challenges and maintain a competitive edge in a volatile economic landscape.

How will public investment in infrastructure boost Vietnam’s cashew industry?

Public investment in Vietnam’s transportation infrastructure and logistics systems is set to significantly boost the cashew import-export industry by directly addressing its primary bottleneck: high transportation costs. These strategic projects aim to connect key production regions more efficiently, thereby reducing both the cost and time involved in transporting goods, particularly exported cashews.

In Binh Phuoc, the cashew capital of the country, two strategic expressways are currently under development: the Gia Nghia – Chon Thanh and the Ho Chi Minh City – Thu Dau Mot – Chon Thanh routes. With a total investment of tens of trillions of VND, these expressways, once completed, will create a seamless transportation corridor directly linking the Central Highlands (Dak Nong) and Southeast (Binh Phuoc) raw material regions with major seaports like Cai Mep – Thi Vai and Ho Chi Minh City.

Prioritizing budget allocation for these key transportation projects is expected to help reduce logistics costs for businesses by 15-20%, thereby significantly boosting the competitiveness of Vietnamese cashews in the international market.

See further: How long can Vietnam maintain its dominance in the cashew industry?

How is Vietnam enhancing cashew value through technology and deep processing?

In addition to physical infrastructure, the government is also tackling two core issues for the cashew industry: low productivity and low added value. The goal is to transform the sector from a raw-export-dependent industry into a more sustainable, efficient, and deep-processing one.

New policies are encouraging the application of science, technology, and smart agriculture. A prime example is the program to replant nearly 2,500 hectares of old cashew trees in Binh Phuoc with new, high-yield varieties, providing seedlings to poor and ethnic minority households. This long-term strategy aims to reduce the industry’s reliance on imported raw materials and improve the quality of domestic cashews.

Furthermore, a significant portion of the Economic Recovery Program budget is dedicated to helping businesses invest in modern production lines. The objective is to increase the proportion of deep-processed products like cashew butter and cashew milk to 30% of the total export value by 2025.

To expand markets, the government is also sponsoring the “International Cashew Conference” in Hanoi in the fourth quarter of 2025. This event will provide an opportunity for Vietnamese businesses to connect directly with potential importers from Europe and the Middle East. This strategic move aims to diversify export markets, mitigate risks, and promote sustainable growth for the entire industry.

What is the market outlook and export price forecast for Vietnamese cashews?

The market outlook for Vietnamese cashews remains highly positive, with the global cashew market projected to reach nearly $10 billion, and the deep-processed segment comprising over half of this value. This trend strongly supports Vietnam’s strategic focus on deep processing. Furthermore, export prices for cashew kernels, particularly the common WW320 type, have seen a robust year-on-year increase of 23-28%, now ranging from $6.80–$7.60 per kg. This significant price surge indicates strong market demand and is expected to substantially boost revenue and profitability for Vietnamese exporters, reinforcing the industry’s confidence in achieving its annual export target of $4.5 billion despite market volatility.

In terms of supply, raw cashew production from major growing nations like Ivory Coast and Cambodia has reached record highs, at 1.3–1.5 million tons and 850,000–900,000 tons, respectively. Additionally, Vietnamese cashew exporters are actively exploring and expanding into new markets. China has emerged as a bright spot, with its import value growing by over 41% in 2025. This presents a golden opportunity for Vietnam to boost its exports, offsetting challenges in the U.S. market.

Meanwhile, the European Union (EU) remains a key market, accounting for over 70% of Vietnam’s total cashew imports. With major markets like Germany and the Netherlands, and particularly the strong growth in the organic cashew segment, the EU is not only a stable market but also a place where Vietnam can assert its position on product quality.

In summary, 2025 is a pivotal year for the cashew industry, with opportunities and challenges intertwined. Grasping market signals, optimising the supply chain, and implementing flexible market diversification strategies will be key for Vietnam’s cashew industry to maintain and strengthen its leading position in the global market.

See more: The Landscape of Vietnam’s Cashew Exports to China: Data and Trends

August 19, 2025 0 comment
0 FacebookTwitterLinkedinWhatsapp
Food & Spicy IndustryMarket Insights

The Landscape of Vietnam’s Cashew Exports to China: Data and Trends

by Henry Truong August 16, 2025
written by Henry Truong

What are the key trends in Vietnam’s cashew exports to China (2015–2024)?

Vietnam’s Cashew Nut Exports to China (2015–2024) (Customs Department data compiled by Vncommex)

From 2015 to 2024, Vietnam’s cashew exports to China showed significant trends, with China consistently ranking as Vietnam’s second-largest market, only behind the United States. Before 2020, Vietnam held a near-monopoly on China’s shelled cashew imports (HS code 080132), capturing up to 97% of the market. This strong position was bolstered by evolving Chinese consumer habits, shifting from viewing cashews as a luxury item to a nutritious daily food, driven by rising living standards and economic growth.

From 2019 onward, Vietnam’s exports to China experienced a rollercoaster of changes. In 2019, amid Sino-U.S. trade tensions, Vietnamese cashew exports to China surged 48% in volume. The growth continued into 2020, despite the pandemic, but was then hindered by logistics bottlenecks in 2021 and a 28% plunge in 2022 due to China’s Zero-COVID policy. Once China reopened in 2023, pent-up demand returned forcefully, sending Vietnam’s export turnover soaring 55% to $683 million, with momentum continuing into 2024, reaching $746 million.

Yet, behind the impressive numbers lies a strategic concern: Vietnam’s market share is slowly eroding despite higher export volumes. This shift is driven by China’s policy to reduce dependence on a single supplier. China is pursuing two strategies:

  1. Diversifying imports of finished cashew nuts, boosting the presence of Ivory Coast (10%), Myanmar (6.8%), and Tanzania (2%) in its market.
  2. Increasing imports of raw cashew nuts (unshelled), with an average of 10,000 tons/year, mainly from Mali, Togo, and Cambodia, to fuel its rapidly expanding domestic deep-processing industry.

A historic milestone occurred in early 2025, when China overtook the United States to become Vietnam’s largest cashew export market—driven by booming demand ahead of the Lunar New Year. In just the first four months of 2025, Vietnam exported 65,795 tons of cashews to China, generating $415 million, marking a 23.36% increase in volume and a 43.21% surge in value year-over-year.

This reflects not only increased consumption, but also a greater willingness among Chinese consumers to pay premium prices for high-quality cashews—especially as gifts and festive staples during the most important holiday of the year. As a result, China’s share of Vietnam’s total cashew export turnover has risen from 21.52% to 26%, a 5-point jump that signals a shifting centre of gravity in Vietnam’s cashew trade.

For a comprehensive analysis with full data tables and insights, refer to the full report: Vietnam Cashew Nuts Import–Export Market Report 2025

How is China’s cashew self-sufficiency strategy impacting Vietnam?

China’s cashew self-sufficiency strategy is significantly impacting Vietnam by reducing its reliance on external suppliers. This long-term approach involves building a self-controlled raw material supply chain through direct investment in overseas farming and processing. As a result, China’s self-sufficiency rate for raw materials has steadily increased from under 5% in 2018 to 18% by 2023, a trend projected to continue.

This strategy follows two key models:

  1. “Grow in Africa + Process in China” – Chinese companies are investing heavily in processing facilities in the Ivory Coast, targeting capacities of up to 100,000 tons/year, cutting raw material costs by as much as 22%.
  2. The “backyard model” in Cambodia – In March 2025, a $12 million cashew processing plant with a capacity of 40 tons/day officially began operations in Cambodia, designed exclusively to serve the Chinese market.

Together, these efforts reflect more than commercial ambition—they demonstrate China’s strategic pursuit of food security and production autonomy. For Vietnam, this presents a dual challenge: not only is China reducing its dependence on Vietnamese cashew processors, but a direct competitor is emerging right next door in Cambodia.

In this new landscape, Vietnam can no longer rely solely on its role as the world’s cashew processing hub. To remain competitive and ensure long-term sustainability, the industry must transform itself into a provider of branded, premium-quality, and high-value-added products—shifting from quantity to quality and from processing to branding.

Conclusion

The period from 2015 to 2024 highlights the impressive resilience of Vietnam’s cashew exports to China, marked by spectacular growth figures and surges in demand. Alongside these opportunities, however, strategic challenges are emerging from the rise of new supply sources in Africa and Cambodia, as well as China’s long-term strategy for raw material self-sufficiency. At this critical crossroads, Vietnam’s cashew industry cannot rely solely on its role as the “world’s processing workshop” to sustain its leading position. To adapt, the industry must transition swiftly toward a more sustainable development model: building strong brands, enhancing quality, diversifying product lines, and moving into higher value-added segments. Only by doing so can Vietnam transform challenges into opportunities, maintain its central role in the global cashew supply chain, and consolidate its position in one of the world’s largest markets – China.

See more:

  • How long can Vietnam maintain its dominance in the cashew industry?
  • Overview of the Vietnam Cashew Market in the First 6 Months of 2025
August 16, 2025 0 comment
0 FacebookTwitterLinkedinWhatsapp
Food & Spicy IndustryMarket Insights

Global Coffee Market Analysis (August 4-11, 2025)

by Henry Truong August 11, 2025
written by Henry Truong

What are the key insights from the VnCommEx Global Coffee Market Analysis for August 4-11, 2025?

See more:

  • The 50% Coffee Tariff and the Future of Global Supply
  • Coffee Market Week 1/7 – 7/7/2025: Vietnam Grows Strongly, Globally Welcomes Surplus Wave
  • Global Coffee 2025: Oversupply in Production, Shortage in Stock & Vietnam’s Ascent
August 11, 2025 0 comment
0 FacebookTwitterLinkedinWhatsapp
Food & Spicy IndustryMarket Insights

The 50% Coffee Tariff and the Future of Global Supply

by Henry Truong August 8, 2025
written by Henry Truong

How does the U.S. import coffee and what’s its current situation?

The U.S. coffee import situation in 2024 shows a diverse sourcing strategy, with total imports valued at approximately USD 8.99 billion and a volume of nearly 1.48 million tons, according to Trademap.org data. Brazil is a strategic supplier, providing 22.4% of the total import value and about 30.7% of the volume, primarily large quantities of green Arabica beans at an average unit price of USD 4,432 per ton. Other key suppliers include Colombia (16.8% of value), Switzerland (13.2% of value, mainly premium processed coffee or re-exports), and Vietnam, which supplies low-cost Robusta (USD 3,758/ton) for blending formulas.

The U.S. is heavily dependent on Brazilian coffee, which makes up 30–36% of its green coffee imports. A 50% tariff will sharply drive up retail coffee prices, as most of the tax burden will be passed on to consumers. Estimates suggest that the trade tension could raise import prices by 1.8%, costing U.S. households about USD 2,400 per year. Retail chains like Walmart and Target have already warned about upcoming price hikes for essential goods.

U.S. roasters will struggle to absorb the entire 50% increase and will be forced to seek alternative sources. However, no other market matches Brazil’s scale, price stability, and logistics capacity, which risks causing supply chain disruptions. Many companies are delaying new orders due to uncertainty over the tariff’s duration. This could force roasters to alter their blend recipes, as Brazilian coffee is a cornerstone of flavour and balance in many product lines.

Small and medium-sized roasters, which typically operate on margins of around 5%, will face intense pressure and risk losing their livelihoods due to rising input costs. Meanwhile, financially stronger corporations will have easier access to the limited alternative supply, worsening conditions for smaller businesses.

Potential solutions include utilizing re-export or processing channels through third countries like Switzerland, Canada, or Mexico to alter the product’s origin, negotiating tariff-free quotas for part of Brazilian imports, or stockpiling before the tariff takes effect. However, since this tariff is politically driven, its removal will depend more on bilateral diplomatic relations than purely on trade balance considerations. This is prompting large coffee chains and U.S. businesses to intensify lobbying efforts to mitigate the impact of the tax policy.

What is Brazil’s current coffee export situation?

Brazil maintained its position as a global leader in coffee exports in 2024, achieving a total export turnover of USD 11.37 billion, which corresponds to approximately 2.77 million tons, with an average export price of USD 4,102 per ton. This strong performance is part of an impressive growth trend from 2020 to 2024, where Brazil’s coffee exports saw an average annual increase of 21% in value and 2% in volume, indicating both rising prices and consistent market expansion.

Brazil’s coffee markets are diverse but concentrated mainly in developed countries. The U.S. is the largest customer, accounting for 16.7% of export value, followed by Germany (15.9%), Belgium (9.7%), and Italy (8.4%). These major markets have maintained stable or slightly increasing import volumes, indicating robust demand for Brazilian coffee. In addition, some emerging markets such as China, Vietnam, Turkey, and Slovenia have posted high growth rates, with China surging by as much as 83% annually between 2020 and 2024.

Export trends also show a shift toward markets with higher purchasing power. Countries such as South Korea, the Netherlands, Sweden, and Australia import Brazilian coffee at average prices above USD 4,250 per ton—higher than the overall average—helping to increase export value even without significant volume growth.

However, Brazil’s coffee exports remain heavily reliant on a few key markets, especially the U.S. and Europe, making the sector vulnerable to trade policy changes or shifts in consumer preferences in these regions. To mitigate these risks, Brazil needs to both maintain quality and supply stability for its traditional partners and expand into new markets, while also developing more processed coffee products to boost value-added exports.

How will the U.S. 50% tariff impact Brazil’s coffee sector?

The U.S. 50% tariff is expected to have a direct and substantial impact on Brazil’s coffee sector, given the significant trade volume between the two nations. In 2024, the U.S. imported approximately USD 1.90 billion worth of coffee from Brazil, totaling 454,000 tons, which represented 16.7% of Brazil’s total coffee export value and 16.4% of its total export volume, according to Trademap.org. With an average export price to the U.S. of USD 4,188 per ton, closely aligning with the overall industry average, any shift in U.S. trade policy directly threatens a major portion of Brazil’s coffee exports.

From 2020 to 2024, Brazilian coffee exports to the U.S. grew by an average of 15% per year in value—lower than the overall industry average of 21%—but in 2024 alone they surged 67% compared to 2023. In terms of volume, the average annual growth was just 2%, yet 2024 saw a spike of 55%. This suggests the U.S. significantly increased purchases, possibly to boost inventories or take advantage of favorable pricing. However, with the new 50% tariff, Brazil’s competitive advantage in the U.S. market will be erased, opening the door for competitors like Colombia, Vietnam, and Honduras to gain market share.

If export volumes remain at 2024 levels, the tariff would push the landed price for U.S. importers from USD 4,188/ton to about USD 6,282/ton. In a market with multiple alternative sources, this price hike would severely weaken Brazilian coffee’s appeal. If the U.S. were to cut imports from Brazil by 50% and switch to other suppliers, Brazil could lose about USD 0.95 billion in revenue—around 8.4% of its total coffee export value.

In response, Brazil is aggressively pursuing market diversification strategies, shifting exports toward new and existing markets, mainly in Asia and Europe. China has quickly emerged as a strategic priority, evidenced by the licensing of 183 Brazilian coffee exporters and a substantial USD 500 million procurement deal with Chinese coffee chain Luckin Coffee. Brazilian industry associations, such as the Brazilian Coffee Exporters Council (Cecafé) and the National Coffee Council (CNC), are actively lobbying their U.S. counterparts, including the U.S. National Coffee Association, to secure coffee’s inclusion on the tariff exemption list, arguing that Brazilian coffee imports actually support U.S. jobs. The Brazilian government is also exploring domestic support policies for affected industries and has enacted an Economic Retaliation Law, giving it the authority to impose counter-tariffs on U.S. goods if negotiations fail.

What will be the global impact of the coffee tariff on supply chains?

The new tariff is expected to significantly reshape global coffee trade routes, necessitating adjustments to traditional supply flows. Brazilian coffee, historically directed primarily to the U.S., will likely be rerouted to new markets in Europe, Asia (particularly China), and other emerging economies. Simultaneously, the U.S. will seek alternative suppliers from regions such as Central America, Colombia, Vietnam, Indonesia, and East Africa, intensifying competition for available supply. While some companies might explore routing shipments through third countries like Mexico or Panama to mitigate tariff costs, this strategy introduces additional complexity and logistical expenses.

This move accelerates supply chain diversification trends but also requires investment in infrastructure and strategic adjustments for coffee brands. In the long term, supply models could become more regionalised, reducing Brazil’s central role but raising operating costs and raw material prices.

With Brazil accounting for 37% of global coffee output (2024), it plays a key role in price-setting for both Arabica and Robusta. A 50% price increase in the U.S. market will not only cause shortages and price hikes domestically but also affect the global market—especially at a time of low inventories and unfavorable weather. While Colombia, Vietnam, Indonesia, and East Africa may benefit from increased demand, their production scale cannot fully fill the gap left by Brazil. Brazil’s output (4.1 million tons) is nearly double Vietnam’s (1.9 million tons), making complete replacement impossible in the short to medium term. Moreover, Brazilian coffee offers consistency, distinctive flavor, and superior logistics—advantages substitutes cannot yet match. Competition for non-Brazilian sources may push prices even higher for U.S. importers, particularly during peak demand seasons.

The global coffee market is entering a period of heightened volatility, with a strong likelihood of broad-based price increases and a fundamental reshaping of traditional trade routes. This situation is accelerating a broader trend toward more diversified and potentially regionalised global supply chains.

Conclusion

The U.S. decision to impose a 50% tariff on Brazilian coffee is not merely a bilateral issue between two economies—it is a development capable of reshaping the entire global coffee supply chain. Economically, this policy raises costs for U.S. consumers, pressures roasters, and intensifies competition among other exporting countries. Politically, it reflects the growing use of tariffs as a leverage tool in international relations. In the short term, the global coffee industry will need to adapt to sudden shifts in trade flows, while in the long term, the market’s future will hinge heavily on diplomatic negotiations and the degree of political stability between the two nations.

See more:

  • Minas Gerais Hailstorm 2025: Big Challenge for Coffee Farmers and Crop Prospects
  • Global Coffee 2025: Oversupply in Production, Shortage in Stock & Vietnam’s Ascent

August 8, 2025 0 comment
0 FacebookTwitterLinkedinWhatsapp
Food & Spicy Industry

How long can Vietnam maintain its dominance in the cashew industry?

by Henry Truong August 2, 2025
written by Henry Truong

What Stops Raw Cashew Exporters from Processing More Cashews Themselves?

Limited Processing Capacity and Infrastructure

Raw cashew-producing countries often struggle to process their own cashews due to a lack of modern facilities and sufficient installed capacity. This means a low proportion of cashews are processed locally, with many existing factories underutilized or inactive. For instance, Tanzania, despite having 57 cashew processing plants, only operates 36, with a combined capacity of 103,395 tons—significantly less than its raw cashew production. Similarly, Cambodia requires at least 50 new medium-sized facilities to achieve its 2027 processing goals.

Additionally, inadequate post-harvest storage and handling infrastructure lead to significant losses and quality degradation, making raw nuts unsuitable for further processing. This affects local processors’ ability to accumulate sufficient quality raw materials.

This infrastructure limitation is a dynamic rather than static issue. When capacity is lacking, raw cashews are exported, reducing the incentive to invest in domestic processing. This creates a vicious cycle where limited infrastructure sustains raw exports, hindering the development of a strong local processing industry. If raw materials deteriorate due to improper handling, they become less attractive for processing, further weakening incentives.

Limited Access to Capital and Financing

Local processors often struggle to secure working capital to purchase raw cashews, especially when competing against well-financed foreign buyers. Initial capital requirements for building a processing plant and acquiring raw materials are substantial. For example, in Tanzania, constructing a 4,000-ton/year facility can cost $1.5 million, plus $3.1 million for raw material procurement.

Local financial institutions tend to avoid lending to cashew processors, perceiving them as high-risk borrowers with low repayment capacity. This hesitation creates a key bottleneck. Combined with the ability of foreign buyers to offer instant cash or higher prices, it distorts the market. Underfunded local processors are unable to compete, even with policies like “local processor purchasing priority,” highlighting a systemic failure of financial markets to support local value addition.

Outdated Technology and Equipment

Many African processors still rely on manual or semi-mechanised tools with limited capacity, resulting in sub-optimal product quality and poor global competitiveness. This contrasts sharply with Vietnam’s efficient processing techniques and modern roasting methods.

Upgrading to efficient modern processing equipment is urgently needed, but it requires significant investment. Dependence on imported machinery can also introduce logistical complications, higher costs, and supply chain disruptions.

Obsolete technologies directly affect kernel quality, such as higher breakage rates or inconsistent output. This makes it difficult for local processors to meet strict international quality standards (e.g., moisture content, defects, pesticide residues, aflatoxin) and certifications (ISO, HACCP, Fair Trade, Organic). Hence, the technology gap is a fundamental barrier to market access and profitability.

High Operating Costs

While some producer countries like Tanzania have very low minimum wages ($0.10/hour), overall labour productivity may be significantly lower (e.g., Tanzania is 30% less productive than India). This means that despite low wages, per-unit costs remain high due to inefficiency.

High energy costs are also a major factor. Tanzania’s energy costs are 2–3 times higher than Vietnam’s, pushing processing costs up (e.g., $150/ton in Tanzania vs. $70/ton in Vietnam).

Logistical and transportation costs are additional challenges. Transporting raw cashews is inefficient (5 containers of raw nuts produce 1 container of kernels). In countries like Vietnam, logistics costs remain high (about 16.8% of GDP), due to port congestion, container shortages, and high shipping rates. However, processing closer to the source (in Africa) may be cheaper for delivery to Europe/US compared to shipping raw nuts to Asia first.

Even with abundant raw materials, high operating costs (energy, inefficient labor, logistics) can eliminate the advantages of local production. This makes it cheaper for international buyers to import raw nuts and process them in more efficient economies (like Vietnam), despite longer transport distances. This creates a “cost-competitiveness trap” for producer nations, rendering local value addition economically unfeasible without major efficiency improvements.

Unfavourable Policy and Regulatory Environment

Many producing countries have introduced policies to promote local processing (e.g., export taxes on raw nuts, kernel subsidies, tax holidays, investment zones, raw material prioritisation for local processors). However, some reports indicate that these policies often fail to deliver the desired outcomes. In Tanzania, the export tax on raw cashews (15% of FOB price or $160/ton) has not significantly boosted local processing, and only a small portion of tax revenue is reinvested in the industry.

Issues like smuggling and informal trade further affect local processors’ access to raw materials. For instance, raw nuts are smuggled from Côte d’Ivoire to Burkina Faso/Guinea-Bissau and from Benin to Togo, undermining domestic processing by diverting raw materials. This is often driven by higher prices in informal markets or laxer regulations.

Export taxes (like Tanzania’s 15%) are intended to encourage domestic processing. But if they’re poorly enforced, not reinvested, or easily bypassed through smuggling, they become ineffective—or even counterproductive. This underscores the difficulty of designing policies that effectively shift market behaviour toward value addition without introducing new distortions.

Market Dynamics and Competition

The dominance of established processing hubs is a major barrier. Vietnam and India together process 93% of the world’s cashews, with Vietnam being the largest processor and exporter of kernels. These countries benefit from economies of scale, well-established supply chains, and strong market access.

Producer countries also struggle to meet strict international standards and market entry requirements for processed kernels. They face challenges meeting quality benchmarks (e.g., moisture, defects, pesticide residues, aflatoxin) and certifications (ISO, HACCP, Fair Trade, Organic) required by major importing markets like the EU and US.

The long-standing dominance of Vietnam and India has created a significant “first-mover advantage.” They control distribution networks, have established buyer relationships, and possess the infrastructure and expertise needed. This entrenched position makes it extremely difficult for new entrants from raw cashew-producing countries to gain market share, even if they overcome local processing challenges. This represents a classic entry barrier in global value chains.

Summary  of Government Incentives for Cashew Processing in Major Producing Countries

How Did Vietnam Become the World’s Top Cashew Processor?

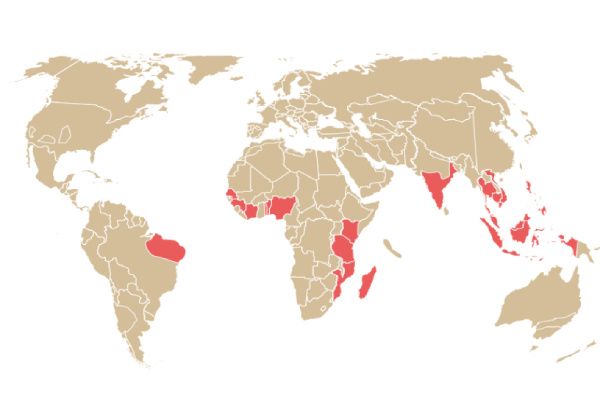
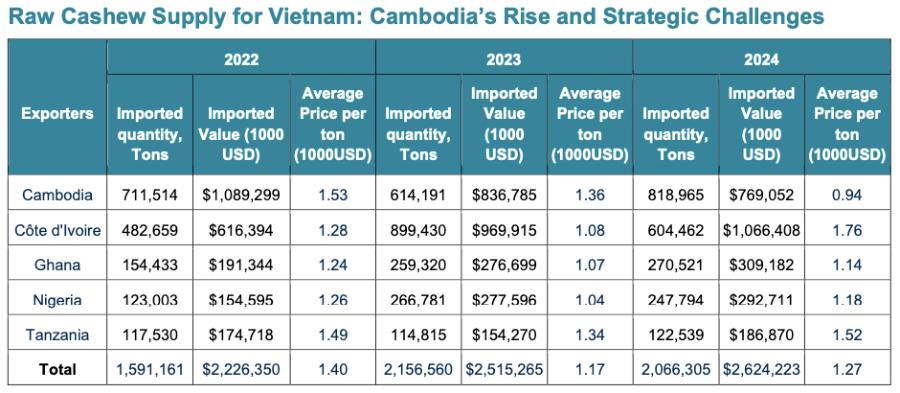
Vietnam has held the title of the world’s leading exporter of processed cashew kernels for 18 consecutive years, responsible for over 80% of global kernel exports. This remarkable dominance is achieved despite the country importing most of its raw cashew materials, primarily from Africa and Cambodia, showcasing a unique strategic advantage in the global cashew value chain.

See more of the analysis of the Cashew nuts industry here: CASHEW NUTS IMPORT & EXPORT MARKET 2025 REPORT

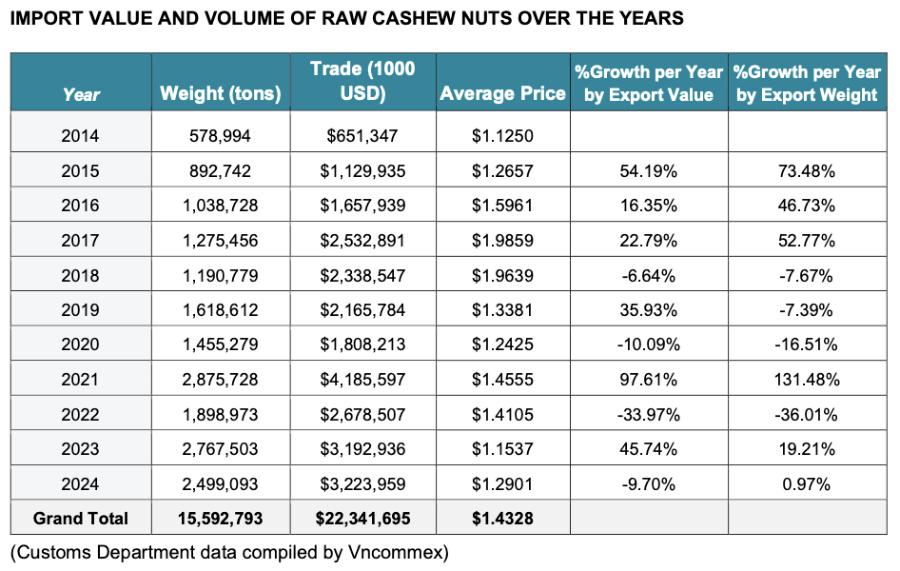
vietnam cashew nuts import
cashew nuts supplying for vietnam
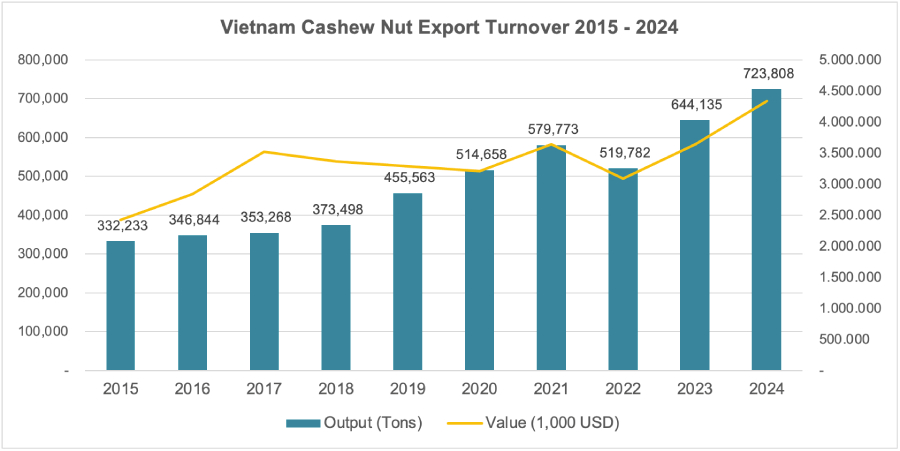
Vietnam cashew nuts export turnover

Key factors behind Vietnam’s success include:

  • Investment in modern processing technology: Vietnam has adopted efficient processing technologies that deliver high-quality kernels at competitive costs.
  • Skilled labour and operational efficiency: Vietnam can process large volumes efficiently, reflecting skilled labour and optimised operations.
  • Strong market access and diversification: Vietnam has diversified beyond the U.S. to markets like China and the EU, benefiting from trade agreements like EVFTA, which reduces EU kernel import tariffs to 0%.
  • Strategic raw material sourcing: Vietnam’s ability to import from various sources ensures a steady supply for its processing industry, even when domestic output fluctuates.
  • Cost efficiency (despite high logistics costs): Despite logistics costs accounting for 16.8% of GDP, Vietnam maintains its dominance through overall processing efficiency and competitive pricing.

Vietnam’s success is not based on raw material self-sufficiency but on its ability to coordinate the global cashew value chain efficiently. It capitalises on processing capacity, market access, and strategic sourcing to capture the most profitable segment, turning its raw material deficit into a competitive advantage. This offers a strategic model for other countries: become a processing hub, even if it means importing raw nuts.

See more of the analysis of the Cashew nuts industry here: CASHEW NUTS IMPORT & EXPORT MARKET 2025 REPORT

What Opportunities Exist for Cashew-Producing Countries to Process More?

Despite the ongoing ‘cashew paradox’—where raw cashew-producing countries export most of their raw materials due to challenges like capital constraints, technological gaps, labor shortages, high operational costs, and inconsistent policies—significant opportunities exist. Local value addition offers substantial economic benefits, including increased foreign exchange earnings, job creation, and economic diversification, which are crucial for sustainable development.

Shifting from raw exports to processed kernel exports is not just an economic choice, but a strategic imperative for these countries to move up the global value chain, enhance resilience, and secure a more prosperous future for their farmers and cashew sectors. Learning from successful models like Vietnam—combined with tailored domestic strategies and international partnerships—is key to unlocking this untapped potential.

What’s Next for the Global Cashew Industry?

While Vietnam currently leads the global cashew value chain, this position is not guaranteed indefinitely. As raw cashew-producing nations increasingly invest in domestic processing capacity, modern technology, and improved policy environments, Vietnam’s role as the primary ‘global processing hub’ is likely to face growing competition and challenges in the coming years.

However, the current gaps in technology, capital, labour, and supply chains remain significant obstacles for competitors. To maintain its edge, Vietnam must not rely solely on its current model—it needs to proactively upgrade its technology, restructure its supply chain for greater sustainability, and expand into high-value segments such as deep-processed products or organic cashews.

If done effectively, Vietnam can not only maintain its leadership but also reshape how the global cashew industry operates for decades to come.

Read more: Overview of Vietnam Cashew Market in the First 6 Months of 2025

August 2, 2025 0 comment
0 FacebookTwitterLinkedinWhatsapp
Food & Spicy IndustryMarket Insights

Minas Gerais Hailstorm 2025: Big Challenge for Coffee Farmers and Crop Prospects

by Henry Truong July 29, 2025
written by Henry Truong

A significant hailstorm hit southern Minas Gerais on July 25, 2025, severely damaging coffee plantations. This key Brazilian Arabica coffee region experienced a storm lasting 20 to 40 minutes, affecting at least 17 municipalities. Monte Santo de Minas was particularly hard-hit, with approximately 60% of coffee farms impacted and 30 farms reporting specific damage.

Emater-MG reports 26,600 hectares of coffee devastated across southern Minas Gerais, Zona da Mata, and Alto Paranaíba. Visible damage includes leaf and fruit loss, broken branches, and severe plant structural harm. Some farmers reported up to 80% damage to directly affected coffee areas. Fortunately, 59% of the region’s coffee was already harvested, reducing the impact on the current crop. Cooxupé, Brazil’s largest coffee cooperative, is assessing the full extent of the damage.

Specific localities also reported significant losses: Itamogi saw about 300 hectares affected, impacting at least 40 producers; Carmo do Rio Claro reported 7 hectares damaged; and Cristina sustained damage to 30% of coffee and banana areas after a 15-minute storm. Other affected areas include Alterosa, Botelhos, Muzambinho, Nova Resende, Lambari, Poços de Caldas, Cambuí, and Campanha.

Southern Minas Gerais produces about 25% of Brazil’s coffee. However, the region frequently faces extreme weather. Historical data shows similar hail events: Itamogi in 2013 (200-300 ha damaged), Carmo do Rio Claro and Cristina in 2015, and Nova Resende and Lambari in 2022. The recurrence of these events in 2013, 2015, 2022, 2023, and 2025, combined with meteorological warnings, indicates that hail in southern Minas Gerais is a persistent and potentially increasing climate risk. This poses significant challenges for the local coffee industry, demanding more effective adaptation and response measures.

How much did the Minas Gerais hailstorm affect Brazil’s total coffee harvest?

While the recent hailstorm in Minas Gerais caused severe local damage to affected Brazilian coffee farmers, its overall impact on the national coffee industry appears to be minimal. The 26,600 hectares of damaged coffee plantations represent only 1.5% of Brazil’s total coffee area. Even in a “catastrophe” scenario, where 100% of these affected areas were destroyed, the total impact would still be just over 3% of Brazil’s 2.4 million hectares of coffee. This includes the 2.25 million hectares of total planting area and 1.86 million hectares of production area.

The Procafé Foundation supports this assessment, stating that the hailstorm is not expected to significantly affect Brazil’s total 2025 harvest. Researcher Alysson Fagundes noted the difficulty in measuring the exact impact but concluded that, “logically, in terms of changing the harvest, it is not significant.”

Fernando Maximiliano, Director of Coffee Market Intelligence at StoneX, conducted a quantitative analysis, identifying 86,770 hectares of coffee area across all cities reporting hailstorms. According to consultants in the region, less than 15% of this area was affected.

However, a critical point for affected producers is the recovery time. Damaged crops will take two years to recover fully. The first year will focus on restoring tree growth and development, with normal production resuming in the second year. Trees that lost leaves and flower buds due to hail may have reduced flowering in the subsequent season, potentially impacting the 2026 harvest. Therefore, while the 2025 yields may see a negligible impact, affected farmers face significant challenges in fully restoring their coffee trees’ yields.

Will the hailstorm impact Brazilian coffee prices or the overall harvest?

The recent hailstorm in southern Minas Gerais has had only a moderate impact on global coffee prices, with market movements largely driven by other factors. While the September/25 Arabica contract on the ICE NY exchange rose to 301.70 cents/lb, this increase is primarily attributed to broader concerns like crop recovery in general and potential US import tariffs on Brazilian goods, rather than the direct effect of the hailstorm. César de Castro Alves, director of agricultural consultancy Itaú BBA, reiterated that “hail is generally a local phenomenon and does not usually have a major impact on prices, unlike frost.”

Consumer coffee prices, as measured by the IPCA-15 index, even saw a slight decline of 0.36% on July 25, marking the first decrease in eighteen months. This suggests that the market is not experiencing widespread panic due to the hailstorm.

Despite the localized damage, Brazil’s overall coffee production for 2025 remains robust, with an estimated 55.7 million bags, representing a 2.7% increase from the previous year. This forecast suggests the largest harvest ever for a “low-yield” year in the biennial cycle, surpassing the 2023 harvest by 1.1%. Specifically, Arabica production is expected to reach 37 million bags, while Conilon (Robusta) is projected to hit a record 18.7 million bags. Minas Gerais, as Brazil’s largest coffee-producing state, is set to harvest 25.65 million bags.

These figures reinforce the perspective that, while the hailstorm inflicted severe losses on individual coffee farmers, its broader impact on national coffee production and prices in 2025 will be limited. However, the long-term outlook for affected farms remains challenging, as full crop recovery is expected to take up to two years, potentially impacting 2026 yields.

What are the long-term effects of the hailstorm on coffee yields and farmer income?

The recent hailstorm inflicted severe physical damage on Brazilian coffee trees, with widespread defoliation, broken branches, and fallen leaves and berries. Critically, reports indicate damage to “chumbinhos” (young coffee berries) and blossoming flowers, signaling a direct and significant impact on future harvests. The severity was such that one producer in Campanha may be forced to uproot both coffee and ponkan trees.

The financial losses for affected farmers are projected to be substantial. With 26,600 hectares of coffee damaged and an estimated average yield of 30 bags per hectare, approximately 1,000,000 bags of coffee could be lost annually over the next two years. If Arabica prices average around R$1,500 per bag during this period, the total revenue loss for these producers could reach a staggering R$3 billion (approximately $550 million USD). Many farmers report “significant losses,” with some experiencing damage to up to 80% of their coffee acreage. A grower in Alterosa described the situation as “terrible,” highlighting the severe defoliation that will undoubtedly affect their future yields.

The market will closely monitor the “actual damage” in these affected areas, particularly its impact on the 2026/2027 harvest. The final production figures for Brazil’s 2025/2026 harvest (currently estimated at 50-55-65 million bags) and the success of the next flowering cycle are key factors to watch in the short term. If Brazil’s 2025/26 crop falls below 55 million bags, New York coffee prices could surge back above 400 cents/lb, driven by the existing global deficit between production and consumption.

This indicates that while the immediate impact of the hailstorm on current market prices may be modest, its longer-term effects on global coffee supply could lead to significant price volatility in the near future. The recovery period of two years for damaged trees, coupled with the potential reduction in the 2026 harvest due to decreased flowering, underscores the enduring challenge faced by these Brazilian coffee producers.

Read more: Global Coffee 2025: Oversupply in Production, Shortage in Stock & Vietnam’s Ascent

July 29, 2025 0 comment
0 FacebookTwitterLinkedinWhatsapp
Newer Posts
Older Posts

Recent Posts

  • Import Vietnamese Coffee: Your Strategic B2B Playbook
  • Vietnam’s Coffee Economy: Market Trends, Export, and Sustainable Future
  • Vietnamese Coffee Brands: Your Definitive Guide to Authentic Flavors, Top Picks & Smart Buying
  • Vietnamese Coffee Taste: Your Sensory Guide to Bold Flavors
  • Vietnamese Coffee: Ultimate Guide to History, Brews & Global Impact

Follow Us

Facebook Linkedin Twitter

Recent Posts

  • Import Vietnamese Coffee: Your Strategic B2B Playbook

    December 17, 2025
  • Vietnam’s Coffee Economy: Market Trends, Export, and Sustainable Future

    December 15, 2025
  • Vietnamese Coffee Brands: Your Definitive Guide to Authentic Flavors, Top Picks & Smart Buying

    December 13, 2025
  • Vietnamese Coffee Taste: Your Sensory Guide to Bold Flavors

    December 12, 2025
  • Vietnamese Coffee: Ultimate Guide to History, Brews & Global Impact

    December 11, 2025

Categories

  • Food & Spicy Industry (30)
  • Free Trade Agreement (18)
  • Fruit & Vegetable (56)
  • Garment & Footwear (11)
  • Market Insights (29)
  • Others (4)
  • Seafood (4)
  • Vietnam Commodity Market Price (17)
  • Vietnam Export Data (15)
  • Vietnam Market (6)
  • Wood & Furniture (19)

Vietnam Commodity Export offers comprehensive and in-depth information on Vietnam’s sourcing market, highlighting opportunities and challenges across various industries. We help international businesses find quality manufacturers and reliable suppliers in Vietnam, providing the critical insights needed to connect with the best partners and resources in the market.

Newsletter Subscribe
    • Homepage
    • Market Insight
    • Sourcing Service
    • Vietnam Overview
    • Publication
    • About Us
    • Contact Us
  • Product Catalogue
    • Coconut Products
    • Tropical Fruits
    • Spicy Products
    • Food & Nuts Products
    • Dried Fruit

You are looking for suppliers in Vietnam!

Shop Now
Facebook Linkedin Twitter Email
VNCOMMEX Group Co. Ltd Address: 06 Vo Van Kiet, Nguyen Thai Binh Ward, District 1, HCMC
Email: info@vncommex.com

All rights reserved. Designed and developed by Vietnam Commodity Exports

Privacy Policy

FAQ

VnCommEx
  • VCE
  • Product Catalogue
  • Market Insight
    • Wood & Furniture
    • Garment & Footwear
    • Food & Spicy Industry
    • Fruit & Vegetable
    • Others
    • Market Insights
  • Vietnam Market
    • Vietnam Commodity Market Price
    • Vietnam Export Data
    • Vietnam in FTA
  • Publication
  • About Us
  • English
    • 中文 (中国)
    • Tiếng Việt
VnCommEx
  • VCE
  • Product Catalogue
  • Market Insight
    • Wood & Furniture
    • Garment & Footwear
    • Food & Spicy Industry
    • Fruit & Vegetable
    • Others
    • Market Insights
  • Vietnam Market
    • Vietnam Commodity Market Price
    • Vietnam Export Data
    • Vietnam in FTA
  • Publication
  • About Us
  • English
    • 中文 (中国)
    • Tiếng Việt
@2021 - All Right Reserved. Designed and Developed by PenciDesign
✕

Shopping Cart

Close
No products in the cart.
Close
 
Return to shop