VnCommEx
Hợp tác xuất khẩu SUBSCRIBE
VnCommEx
Hợp tác xuất khẩu SUBSCRIBE
  • VCE
  • Product Catalogue
  • Market Insight
    • Wood & Furniture
    • Garment & Footwear
    • Food & Spicy Industry
    • Fruit & Vegetable
    • Others
    • Market Insights
  • Vietnam Market
    • Vietnam Commodity Market Price
    • Vietnam Export Data
    • Vietnam in FTA
  • Publication
  • About Us
  • English
    • 中文 (中国)
    • Tiếng Việt
VnCommEx
VnCommEx
  • VCE
  • Product Catalogue
  • Market Insight
    • Wood & Furniture
    • Garment & Footwear
    • Food & Spicy Industry
    • Fruit & Vegetable
    • Others
    • Market Insights
  • Vietnam Market
    • Vietnam Commodity Market Price
    • Vietnam Export Data
    • Vietnam in FTA
  • Publication
  • About Us
  • English
    • 中文 (中国)
    • Tiếng Việt
All Right Reserved. Designed and Developed by PenciDesign
Food & Spicy IndustryMarket Insights

Global Coffee 2025: Oversupply in Production, Shortage in Stock & Vietnam’s Ascent

by Henry Truong July 28, 2025
written by Henry Truong

Vietnamese domestic coffee prices experienced significant volatility in early 2025. The year began with a strong upward trend, as prices in January reached VND120,000/kg. This momentum continued into February, with prices climbing to VND131,000/kg, marking a 9.17% increase month-over-month. The peak was observed in March 2025, when coffee prices hit a record high of VND135,400/kg, a 3.36% rise from February.

Following this peak, a downward trend emerged. By April 2025, domestic prices had fallen to VND127,000/kg, representing a 6.2% decrease from the previous month. This decline persisted into May, with prices reaching VND125,000/kg. A particularly sharp drop occurred from June 2025 onwards, as prices plummeted to VND99,000/kg, a substantial 20.8% reduction compared to May.

Between the beginning of May and the end of July, domestic coffee prices in Vietnam collectively decreased by nearly 28%. The lowest point was recorded on July 11th, with prices falling to VND92,500-92,600/kg. However, by the close of July 2025 (specifically July 27th), prices showed signs of stabilisation, trading around VND95,300-95,500/kg. This indicates a potential calming of the market after the steep decline.

How do global coffee prices affect Vietnam’s coffee market?

The world coffee market often mirrors Vietnam’s domestic price fluctuations. For example, Robusta coffee prices on the London exchange experienced notable declines, including a significant drop of USD 146–161/ton on July 22nd, reflecting similar downward trends seen in Vietnam. Conversely, some recent sessions in July (specifically July 23rd–25th) have shown a tendency for global coffee prices to rebound, indicating a dynamic and interconnected market.

Currently, domestic coffee prices in Vietnam are about USD 0.28 per kilogram higher than the price of September 2025 futures contracts, indicating that investors are anticipating a decline in coffee prices in the coming months.

What are Vietnam’s coffee production forecasts and climate challenges?

Climate change significantly impacts Vietnam’s coffee industry, affecting both yield and productivity. For instance, the 2023–2024 crop year saw a considerable drop in production due to El Niño and reduced planted areas from crop conversion. However, with heavy rainfall in 2024, Vietnam’s coffee yields are expected to recover. The U.S. Department of Agriculture (USDA) forecasts Vietnam’s coffee production in the 2024–2025 crop year to reach 1.8 million tons (approximately 30 million bags), an increase of about 150,000 tons compared to the previous season, signaling a potential rebound.

The recovery in production across most major coffee-producing countries is exerting downward pressure on futures contract prices. Specifically, prices for September 2025, November 2025, and January 2026 futures contracts are all showing a steady declining trend. This suggests that during Vietnam’s harvest season in November–December 2025, domestic coffee selling prices will likely be lower than in the 2024 crop year.

According to a Reuters survey, Robusta coffee prices are forecast to end 2025 at around USD 4,200 per ton, down 28% from the closing price at the time of the survey (around February 2025). The primary reason for this price decline is the improved supply from major producers such as Brazil and Vietnam. Specifically, Vietnam’s Robusta coffee production is forecast to increase to 29 million bags in the 2024–2025 crop year (up from 28 million bags in 2023–2024), and may even reach 31 million bags in the 2025–2026 crop year.

Trend of fluctuation in Vietnamese coffee prices (blue: export price, red: domestic price)

Daily index prices and futures prices of global coffees (US cents/lb)

The global coffee market has demonstrated a striking divergence in price trends between its two primary varieties, Arabica and Robusta, over the past year (July 2024 to June 2025). This period has been characterised by robust demand and rising prices for Arabica, contrasted with a general decline in Robusta prices driven by improved supply.

Arabica Coffee: Surging Prices and Strong Demand

Arabica coffee prices have experienced a sharp and sustained increase during this period. Varieties such as Colombian Milds, Other Milds, and Brazilian Naturals have shown impressive gains, with some increases reaching up to 40%. The New York Stock Exchange price index for Arabica mirrored this trend, registering a significant 40.15% increase. This substantial appreciation in price reflects strong global demand for Arabica coffee and potential concerns regarding its supply.

Despite these elevated prices, Colombian Arabica coffee exports have shown remarkable resilience. Year-to-date figures from October 2024 to May 2025 indicate a 15.5% increase in exports, reaching 9.35 million bags compared to 8.09 million bags in the corresponding period last year. Furthermore, the share of Arabica coffee in total green coffee exports for the first eight months of the 2024/25 coffee crop year (to May 2025) rose from 60.8% to 62.9% compared to the same period in the previous year. These figures underscore a clear preference for Arabica coffee among global consumers, demonstrating inelastic demand even in the face of higher prices.

Robusta Coffee: Price Declines Amidst Supply Recovery

In stark contrast, Robusta coffee prices have generally trended downwards. Both the outright Robusta coffee prices and the London price index have seen declines of 8.62% and 5.53%, respectively. This downward pressure is primarily attributable to a significant recovery in output from key Robusta-producing nations:

  • Vietnam: Production increased from 26.5 million bags (60kg) to 28 million bags (60kg).
  • Indonesia: Output surged from 6.8 million bags to 9.3 million bags.

The notable production growth in these two major Robusta suppliers has effectively rebalanced the supply and demand dynamics within the Robusta market, leading to a moderation and subsequent decline in prices for this coffee variety. This illustrates the sensitivity of Robusta prices to supply-side improvements, especially from dominant producers.

2023/24 Production Overview: Arabica Leads Growth

Global coffee production in the 2023/24 crop year is estimated at 178 million bags, marking a 5.80% increase compared to the 2018/19 season. This growth was primarily spearheaded by Arabica production, which saw an impressive 8.80% rise to 102.2 million bags. In contrast, Robusta production recorded a more modest increase of 2.10%, reaching 75.8 million bags.

Regionally, Africa and South America exhibited substantial production growth, with increases of 12.10% and 9.80%, respectively. Conversely, production in the Caribbean, Central America & Mexico experienced a slight decline of 2.50%.

Looking ahead, global coffee production in the 2025/26 crop year is anticipated to reach a record 178.7 million bags, an increase of 4.3 million bags from the previous year. This projected growth is largely attributed to a robust recovery in production from Vietnam and Indonesia, alongside record output from Ethiopia.

Despite this burgeoning supply, global coffee consumption is also expected to reach an all-time high of 169.4 million bags. However, the increased production is projected to outpace consumption, leading to a forecast supply surplus of approximately 9.3 million bags in the 2025/26 marketing year. This potential surplus suggests a shift in market dynamics that could influence future price trends.

Why are global coffee prices high despite a projected surplus?

Despite forecasts for a supply surplus in the 2025/26 crop year, global coffee prices remain paradoxically high due to significant inventory challenges. This situation highlights a critical disconnect between long-term production outlooks and immediate, available supplies, creating a market where scarcity in the short term drives up prices even with a projected future oversupply.

Alarmingly Low Global Ending Stocks

Global ending stocks are projected to decrease by 6.6%, falling to a range of 20.87 to 22.8 million bags. This decline is particularly alarming as it represents the lowest level in 25 years on a stocks-to-use basis. This tight supply situation is the primary driver behind the persistent elevation of coffee prices. The International Coffee Organization (ICO) composite price index vividly reflects this pressure, having surged by over 90% in the past two years.

Arabica Stocks: Precarious Shortages

As of July 2025, certified Arabica stocks on the ICE Futures US exchange in New York have plummeted to just 806,062 bags, marking a three-month low. These stocks have been on a consistent downward trajectory throughout 2025, with a notable one-day drop of 34,000 bags in June, the largest single-day decrease since January. A significant portion of these certified stocks, 89.84% (724,193 bags), are held in warehouses across Europe, highlighting a geographic concentration of the remaining supply.

The precarious Arabica stock situation is further compounded by expiring contracts and traders’ anxieties regarding maintaining positions in near-delivery months. This has fueled persistent price volatility and prompted an unusually early rollover of contracts from July to September, a market phenomenon not witnessed in analysis since 1991.

Robusta Inventories Rise, Yet Prices Remain Pressured

In stark contrast to Arabica, certified Robusta inventories on the London exchange have experienced a substantial increase, reaching 6,882 lots (equivalent to 68,820 tonnes)—their highest level in a year. This surge is primarily attributed to the accelerated Brazilian Robusta harvest and the arrival of new-crop beans from Indonesia.

However, the significant disparity between the dwindling Arabica inventories and the growing Robusta inventories is exerting particular downward pressure on Robusta prices. As a result, September Robusta futures prices have fallen to a 14-month low.

Regional Stocks at Record Lows

Beyond the exchange-monitored inventories, green coffee stocks in major consuming regions are also at concerningly low levels:

  • European Coffee Federation (ECF) stocks stand at just 7.07 million bags, approximately 5 million bags below their five-year average.
  • Japan Coffee Association (JCA) stocks are similarly depleted at just 2.21 million bags, roughly 500,000 bags below their average.

The combination of persistently low global stocks and limited certified inventories on exchanges continues to be the dominant factor supporting high coffee prices, even in the face of a projected production surplus. This market behaviour suggests that immediate availability and short-term demand concerns are currently outweighing long-term supply forecasts.

How did Vietnam’s coffee exports perform in H1 2025?

In the first six months of 2025, Vietnam’s coffee exports achieved remarkable success, reaching approximately 995,000 tons and generating over USD 5.5 billion in turnover. This figure officially surpassed the total export value for the entirety of 2024 (USD 5.48 billion), setting a new record for the industry. The average export price during this period also hit an unprecedented high of an estimated USD 5,708.3/ton, marking a substantial 59.1% increase over the same period in 2024.

Compared to the first six months of 2024, coffee exports witnessed a 5.3% increase in volume and a dramatic 67.5% surge in value. Other reported figures also indicate a 6% increase in volume and a 69.36% rise in turnover, further underscoring the strong growth in overall value.

With this impressive growth momentum, the Ministry of Agriculture and Environment forecasts that Vietnam’s coffee export turnover could reach USD 7.5 billion by the end of 2025, representing an increase of nearly 37% compared to 2024. This ambitious target reflects the industry’s strong performance and its growing contribution to the national economy, even though Vietnam’s global market share, while significant, might only account for approximately 7-8% of total coffee exports.

Which European markets are key for Vietnamese coffee exports?

Europe remains Vietnam’s most significant coffee export market, consistently demonstrating strong demand. In the first half of 2025, the continent accounted for approximately 39% of Vietnam’s total coffee export turnover, highlighting its crucial role and the impressive growth of Vietnamese coffee, even as new regulatory challenges emerge.

Which specific European countries import the most Vietnamese coffee?

Germany emerged as Vietnam’s largest coffee import market in the first six months of 2025, capturing over 15% of the country’s total export volume and turnover, specifically 16.3% of the market share according to the Ministry of Agriculture and Environment. Vietnam exported 149,543 tons of coffee to Germany, generating a remarkable turnover of $824.85 million USD, with an average price of $5,516 USD/ton. Compared to the first half of 2024, exports to Germany saw a 33.2% increase in volume, a sharp 115% surge in turnover, and a 61.5% rise in price, highlighting this market’s exceptional breakthrough.

Italy ranked second within the EU, accounting for 7.9% of the market share. Vietnam exported 76,993 tons of coffee to Italy, equivalent to $409.22 million USD, at an average price of $5,315 USD/ton. While the export volume to Italy decreased by 11% compared to the first half of 2024, the turnover impressively increased by 48%, and the average price rose by 66.6%, reflecting the broader trend of rising global coffee prices. The export value to Italy in the first five months of 2025 increased by 45.1%.

Spain secured 7.4% of the market share. Vietnam exported 69,539 tons of coffee to Spain, reaching $403.85 million USD, with an average price of $5,808 USD/ton. Compared to the same period in 2024, export volume to Spain grew by 8%, turnover sharply increased by 71%, and prices rose by 58.3%. The export value to Spain in the first five months of 2025 increased by 55.8%. Vietnam has maintained its position as the largest coffee supplier to Spain since 2022, a leadership that continues to be consolidated.

What are the fastest-growing European markets for Vietnamese coffee?

The United Kingdom recorded strong growth in the first six months of 2025, with a 95% increase in turnover and a 26.6% rise in output, reaching $128 million USD with an export volume of 21,000 tons. Although accounting for a smaller share of the market at 2.3%, the UK represents a highly promising market for Vietnamese coffee, particularly instant coffee, given its reputation as one of Europe’s largest instant coffee-consuming markets, alongside Russia.

Further contributing to Vietnam’s European success, Poland saw a remarkable 70% increase in volume and a 137% surge in value of Vietnamese coffee imports in the first half of 2025, totaling $91.4 million USD at 11,732 tons. Belgium also demonstrated significant growth, with a 34% increase in volume and a 114% rise in value, reaching $185 million USD at an output of 34,420 tons. Additionally, the Netherlands, a crucial coffee transit hub, experienced a 22% increase in volume and a 92% increase in value, amounting to $223 million USD at an output of 38,255 tons.

How does the EU Deforestation Regulation (EUDR) impact Vietnamese coffee exports?

The new EU Deforestation Regulation (EUDR) presents both significant challenges and substantial opportunities for the Vietnamese coffee industry. This regulation mandates that 100% of coffee products imported into the European Union must be fully traceable, requiring the provision of GPS coordinates or polygons for each production garden. Non-compliance, particularly in cases of documented deforestation or forest degradation linked to the product, will lead to severe consequences, including shipment recalls or refunds, making compliance crucial for Vietnamese exporters.

Despite the stringent nature of the EUDR, Vietnam has been classified as a “low-risk” country by the EU. This classification provides a significant competitive advantage, as it reduces the frequency of inspection for Vietnamese coffee export shipments to a mere 1%. This streamlined process significantly eases the administrative burden and potential delays for Vietnamese exporters compared to those from “standard” or “high-risk” countries, which face higher scrutiny levels (3% and 9% respectively).

What are the key trends in Vietnamese coffee exports to the Americas?

Mexico has emerged as a market with truly spectacular growth for Vietnamese coffee, exhibiting a 71.6-fold increase in export turnover within the top 15 largest export markets. This dramatic surge underscores the immense, previously untapped potential of the Mexican market for Vietnamese coffee producers, signaling a significant shift in regional demand.

Canada also recorded strong growth, with an estimated turnover of $80 million USD, an increase of approximately 300%. This sudden growth is partly attributed to “tariff evasion” activities in the second quarter of 2025, suggesting strategic adjustments by importers to navigate trade policies.

The United States remains a crucial traditional market, with a turnover of $299 million USD, marking a 72.4% increase in the first five months of 2025. The U.S. continues to be the primary destination for Vietnam’s deeply processed coffee, particularly instant coffee and specialty coffee, indicating a preference for value-added products.

How do US tariff policies affect Vietnamese coffee exports?

However, the U.S. market presents new challenges due to evolving tariff policies under the Trump Administration. In April 2025, an initial tariff of at least 10% was announced on nearly all imported goods, including coffee. More critically, on July 7, 2025, the U.S. government announced an increased specific tariff rate for Vietnam to 20%, effective from August 1, 2025. While this is lower than the originally planned 46%, it is still a significant tariff that could impact the price and competitiveness of Vietnamese coffee in the U.S. market during the latter half of 2025, leading some U.S. importers to seek alternative suppliers.

Which African markets show the most potential for Vietnamese coffee?

The African market has shown explosive growth for Vietnamese coffee, with Algeria standing out as a bright spot. It recorded the most impressive growth among the top 15 largest export markets, reaching a turnover of $294 million USD and a phenomenal growth of 253.5%. The volume of coffee exported to Algeria reached nearly 56,800 tons, an increase of 123%. With a population of 46 million people and a high per capita coffee consumption rate (nearly 130,000 tons annually, predominantly Robusta), Algeria presents substantial potential for Vietnamese coffee in the North African market and serves as a strategic gateway into the broader Muslim market.

What is the status of Vietnamese coffee exports to Asian markets?

Within the ASEAN bloc, Vietnam earned $496 million USD from coffee exports, a 25.1% increase compared to the first five months of 2024. The Philippines emerged as the largest ASEAN market, with a turnover of $151.9 million USD, representing a 36.2% increase. The Philippines is also Vietnam’s largest agricultural export market in the region, with a total turnover of $1.12 billion USD, underscoring its strategic importance.

Japan’s coffee import turnover from Vietnam increased by 58%, reaching $378.6 million USD. However, it is notable that the import volume decreased by 4.8%, from 63,000 tons to 60,000 tons, in the first six months of 2025 compared to the same period in 2024. This suggests that the increase in value is primarily driven by higher unit prices.

China recorded a 24% growth in turnover but a 1% decrease in output, reaching a turnover of $129 million USD after the first six months of 2025. Despite having the lowest growth rate among the top 15 markets, China is still considered a highly important potential market in the Northeast Asia region due to its vast population and evolving consumer habits, which are gradually shifting towards increased coffee consumption. This market presents long-term strategic opportunities as its coffee culture continues to deepen.

Vietnam’s coffee industry is recovering strongly in both output and exports, but faces new challenges from climate change, market volatility, and global trade regulations. Despite short-term downward pressure on prices due to rising global supply, Vietnam remains a key player in the Robusta market. To sustain growth, the industry must improve traceability, adapt to environmental standards, and focus on long-term competitiveness.

See more: Coffee Market Week 1/7 – 7/7/2025: Vietnam Grows Strongly, Globally Welcomes Surplus Wave

 

July 28, 2025 0 comment
0 FacebookTwitterLinkedinWhatsapp
Food & Spicy IndustryFruit & Vegetable

Vietnam’s Rise in the Global Frozen Tropical Fruit Market: Trends, Drivers, and Outlook 2024–2028

by Henry Truong July 22, 2025
written by Henry Truong

The global frozen tropical fruit market is undergoing rapid growth, solidifying its position as one of the fastest-rising sectors in the food industry. From an estimated value of $4.0 billion in 2020, the market rebounded sharply post-pandemic, reaching $4.3 billion in 2021—reflecting a 7.5% growth rate. This upward trend has continued steadily: $4.5 billion in 2022, $4.59 billion in 2023, $4.71 billion in 2024, and a projected $4.89 billion in 2025.

Several key factors fuel this momentum. Chief among them is the increasing volatility in fresh fruit pricing. Since 2020, retail prices for fresh produce have surged—up 30% in the EU and 19% in the US by January 2025—prompting consumers and foodservice operators to turn to more stable, longer-shelf-life options like frozen fruit.

Specific frozen fruit products have seen exponential growth. Notably, frozen orange juice futures soared 370% between January 2020 and January 2025, driven by pandemic-related disruptions and climate impacts in major growing regions such as Brazil and Florida.

These trends reflect a broader consumer shift toward convenience, cost-efficiency, and climate-resilient food sourcing—positioning frozen tropical fruit as a strategic solution within the global food supply chain.

How is the smoothie trend driving demand for frozen fruits?

The booming smoothie trend is a significant catalyst for the frozen fruit market’s expansion, contributing approximately 30% to its overall growth. This surge is directly linked to the global rise in health-conscious lifestyles, which has amplified demand for smoothies, cold-pressed juices, and other functional beverages that heavily utilize frozen fruits such as berries, mangoes, and various tropical varieties.

In the United States, per capita frozen fruit consumption surged 61% between the early 1980s and 2015, reaching 4.8 pounds per person. Frozen berries were key in this rise, with demand doubling over the same period. Consumers are increasingly drawn to frozen fruits’ long shelf life, nutritional preservation, and convenience—traits well-aligned with today’s fast-paced, wellness-driven habits.

Why are frozen tropical fruits the fastest-growing segment?

Frozen tropical fruits are rapidly emerging as the fastest-growing category within the frozen produce market, driven by their increasing popularity and versatility. Currently valued at approximately $2.5 billion in 2024, this segment already accounts for 44% of the global frozen fruit market and is projected to reach $4.5 billion by 2033, demonstrating a robust Compound Annual Growth Rate (CAGR) of 7.5% that significantly outpaces the overall market.

While the general frozen fruit market grows at a CAGR between 5.76% and 6.7%, frozen tropical fruits—including mango, pineapple, banana, and papaya—boast a remarkable CAGR of 13.8%. This performance underscores their role not just as a product category, but as the core driver of global market expansion.

Mango leads the segment with a 35% market share, followed by pineapple (30%) and papaya (20%). Their appeal lies in their naturally sweet flavor, dense nutritional profile (rich in vitamins A and C, antioxidants, and fiber), and culinary flexibility—from smoothies and desserts to sauces and savory dishes.

Which countries are the top exporters of frozen fruits and nuts (HS 0811)?

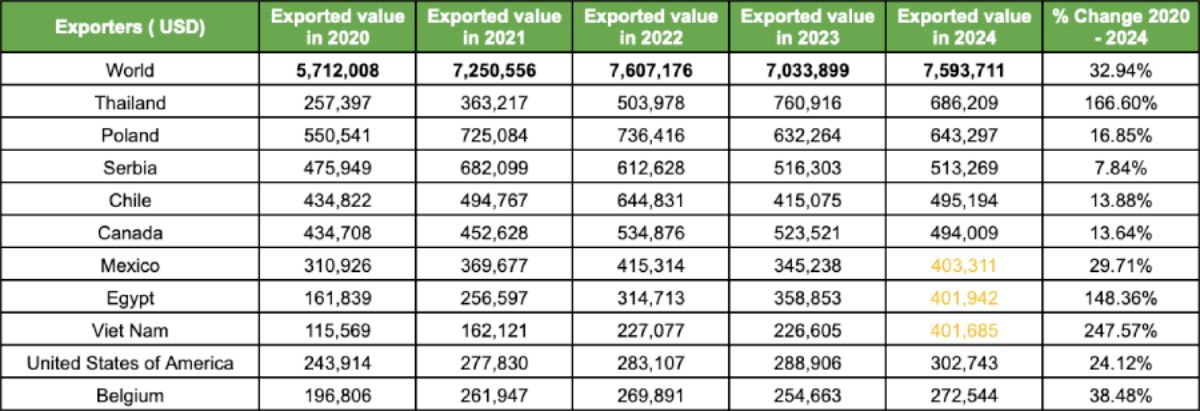
The global frozen fruit and nut export market, identified by HS Code 0811, witnessed substantial growth between 2020 and 2024, with its total export value increasing by nearly 33%—from USD 5.71 billion to USD 7.59 billion. This significant surge underscores a growing worldwide demand for frozen produce, fueled by evolving health trends, the need for resilient supply chains, and consistent year-round requirements for fruit-based ingredients.

Amid this overall expansion, three countries stood out for their exceptional growth performance:

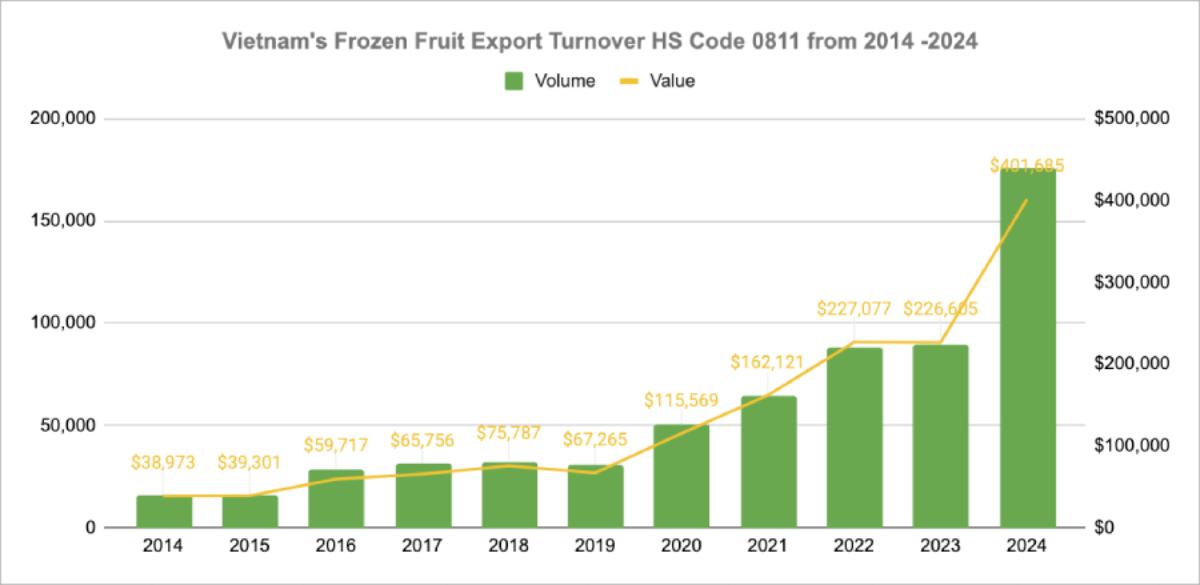
  • Vietnam: Leading the global surge, Vietnam’s frozen fruit exports grew by 247.57%, rising from USD 115.57 million in 2020 to USD 401.69 million in 2024.
  • Thailand: Ranked second, Thailand achieved 166.60% growth, with exports jumping from USD 257.40 million to USD 686.21 million, becoming the top global exporter in this category by value.
  • Egypt: Also showing remarkable performance, Egypt’s exports increased by 148.36%, climbing from USD 161.84 million to USD 401.94 million.

This rapid growth—especially with two Southeast Asian nations among the top three—highlights the region’s rising dominance in global frozen tropical fruit supply chains. It reflects Southeast Asia’s strength in fruit cultivation, cold-chain development, and export processing, all in response to growing international demand for healthy, convenient, and diverse frozen fruit products.

What is Vietnam’s role in global frozen fruit exports (HS Code 0811)?

Product: Frozen Fruits and Nuts, Uncooked or Steamed/Boiled in W ater (with or without added sugar)

Metrics: Volume in Tons | Value in USD

Within the Southeast Asian region, Vietnam is rapidly establishing itself as a pivotal player in the global frozen fruit trade, with a particular focus on frozen tropical fruits like mango. Vietnam’s strong performance under HS Code 0811, which covers frozen fruits and nuts (sweetened or not), is a testament to its robust supply capacity, competitive pricing strategies, and increasing recognition on the international stage.

1. Surging Export Volume and Value: Despite slight fluctuations in 2023, Vietnam’s export value soared to USD 401.69 million in 2024. Export volume nearly doubled, from 88,126 tons in 2022 to 176,083 tons in 2024, underscoring Vietnam’s ability to scale production and meet international demand.

2. Price Competitiveness in the Global Market: Vietnam offers one of the lowest average export prices at just USD 2.28/kg in 2024. This is significantly more affordable than Thailand (USD 6.49/kg) and Malaysia (USD 9.92/kg). This cost advantage makes Vietnamese products highly attractive in price-sensitive markets and supports wider distribution in regions like the EU, Middle East, and East Asia.

However, this pricing also reflects a gap in value-added processing technologies. While countries like Thailand and Malaysia export more refined, consumer-ready frozen goods, Vietnam still largely focuses on bulk, semi-processed exports.

3. Quality and Product Diversity: Vietnam’s frozen fruits—especially frozen mangoes—are gaining global trust for their consistent quality and the distinctive flavor of tropical produce. Exporters also benefit from the country’s diverse fruit basket, including dragon fruit, passion fruit, banana, and pineapple. These varieties align well with the growing demand for exotic fruits in health, beverage, and dessert industries worldwide.

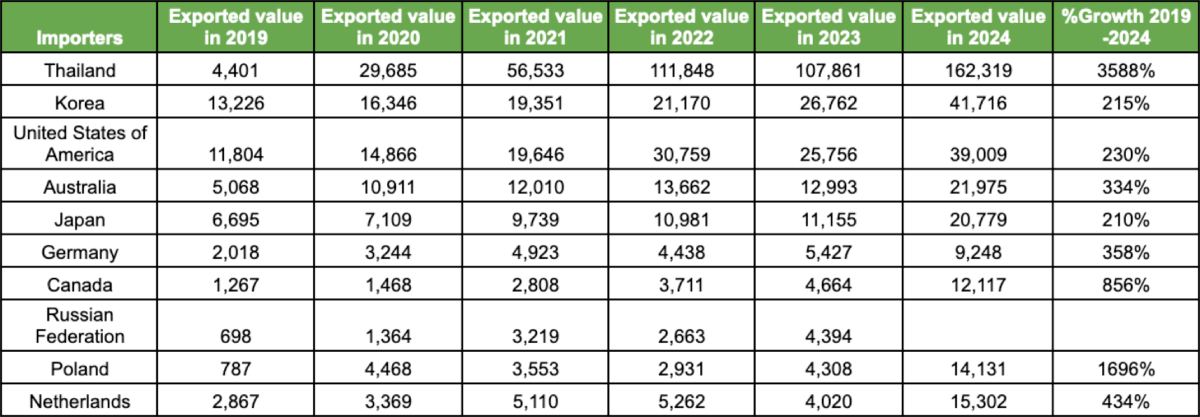
Top 10 countries importing frozen fruits and nuts from Vietnam under HS code 0811 from 2019 – 2024 by value (USD)

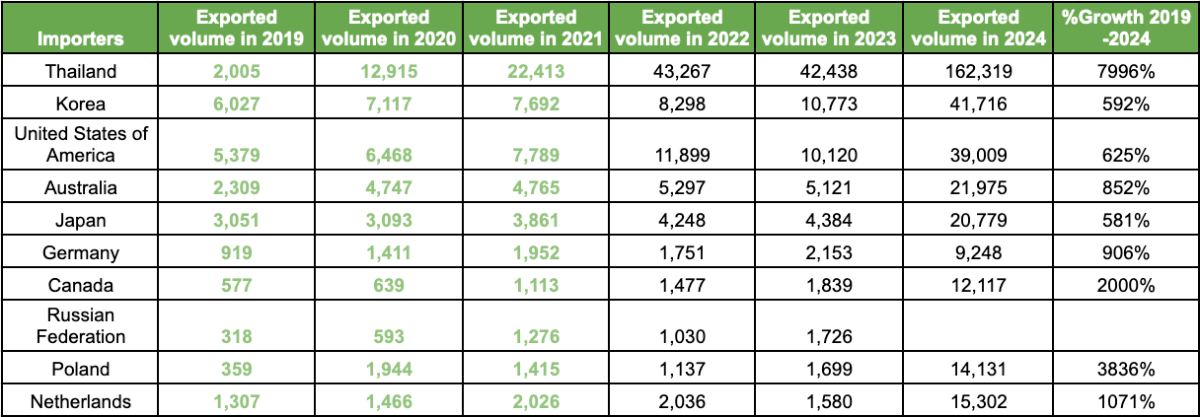
Top 10 countries importing frozen fruits and nuts from Vietnam under HS code 0811 from 2019 – 2024 by volume (tons)

In 2024, Vietnam exported approximately 107,000 tons of frozen tropical fruits, contributing 20% of Asia’s total export volume for this segment. This achievement makes Vietnam the second-largest exporter in the region by volume, behind Thailand.

In terms of value, Vietnam’s frozen fruit exports reached around USD 240 million, capturing 15% of the Asian market share—trailing Thailand and China.

Key Export Destinations (by Volume, 2024):

  • Thailand: 47%
  • United States: 11%
  • South Korea: 10%

While Thailand remains the largest importer of Vietnamese frozen fruits, shipments to South Korea and the U.S. also showed strong performance.

Looking at overall fruit and vegetable exports, China remains Vietnam’s top market, accounting for 64% of total export value in the first half of 2024—reaching USD 2.1 billion. Other major destinations include:

  • South Korea: up 55% to USD 164 million
  • United States: up 33% to USD 157 million
  • Thailand: up over 80%

Why is Thailand a top destination for Vietnam’s frozen fruit exports (HS 0811)?

Thailand has become Vietnam’s largest and most rapidly expanding export market for frozen fruits (HS 0811), significantly contributing to the industry’s growth since the pandemic. From 2019 to 2024, Thailand’s imports of frozen fruits from Vietnam surged dramatically from just USD 2,000 to USD 162,000, showcasing a robust bilateral trade partnership. By 2024, Thailand was importing three times more frozen fruits from Vietnam than from China, its second-largest supplier.

Key Growth Drivers

1. Rising Domestic Demand

Thailand now holds the highest per capita frozen fruit consumption in Asia, reaching 2.2 kg/person in 2024. This surge reflects a consumer shift toward healthy, convenient food options—a trend mirrored in Thailand’s growing demand for frozen vegetables and processed potatoes. The convenience, long shelf life, and nutritional preservation of frozen fruits align with Thai consumers’ fast-paced, health-conscious lifestyles.

2. Industrial Demand and Re-Export Needs

Despite being a major agricultural producer, Thailand’s fruit harvest is highly seasonal. Key tropical fruits such as durian, mangosteen, rambutan, lychee, and longan have narrow harvest windows between April and October, creating significant off-season supply gaps.

This poses a challenge for Thailand’s thriving food processing sector, which contributed USD 26.5 billion in exports by 2023 and aims to become a top 10 global processed food exporter by 2027. To maintain year-round production, the industry relies on stable imports of frozen fruit to supplement domestic shortfalls.

Vietnam has emerged as a strategic supplier, capable of delivering consistent volumes and quality to meet Thailand’s industrial processing and re-export requirements—especially in the post-COVID-19 period. This has solidified Vietnam’s role as Thailand’s primary frozen fruit partner in Southeast Asia.

What makes Vietnam a rising force in global frozen fruit exports?

Since the COVID-19 pandemic, Vietnam has solidified its position as Thailand’s largest frozen fruit supplier under HS Code 0811, with export value dramatically increasing from USD 2,000 in 2019 to USD 162,000 in 2024. By 2024, Thailand’s imports from Vietnam were three times higher than those from China, highlighting a strengthening bilateral trade relationship and Vietnam’s enhanced credibility in the global frozen fruit market.

But Vietnam’s momentum extends beyond Thailand. Its exports are gaining traction globally—thanks to a combination of agricultural strength, government support, and expanding product diversity.

Key Strengths Fueling Vietnam’s Export Growth

1. Abundant and Diverse Fruit Supply

Vietnam cultivates over 1.3 million hectares of fruit trees, yielding roughly 15 million tons of fresh produce annually. The country has identified 14 priority fruit crops—including mango, dragon fruit, banana, durian, jackfruit, and passion fruit—to focus on through 2025. These fruits are central to a national strategy targeting USD 5 billion in export turnover from this group by 2025.

2. Strong Government Support for Processing

Vietnam’s government actively backs agri-processing through investment incentives, particularly for cold chain infrastructure.

  • Up to 60% of project costs (maximum VND 15 billion) for infrastructure and equipment in processing zones, contingent on processed product value increasing at least 1.5 times over raw materials.
  • Up to 70% of costs (capped at VND 2 billion) for preservation systems, including freezing, drying, irradiation, and sterilisation technologies.

These incentives aim to enhance value addition, food safety, and global competitiveness.

Key Bottlenecks Hindering Full Potential

Despite its strengths, Vietnam’s cold chain logistics remain underdeveloped—limiting the scale and quality of frozen exports.

1. High Logistics Costs: Logistics expenses account for over 20% of Vietnam’s GDP, nearly double the global average (11%) and significantly higher than Thailand (14%) and Malaysia (8%). This erodes competitiveness in cost-sensitive markets.

2. Limited Cold Storage Capacity: Vietnam has only about 80 cold storage facilities, mostly concentrated in the South—home to Ho Chi Minh City and the Mekong Delta, the country’s main agricultural hubs. The lack of nationwide storage coverage creates supply chain bottlenecks for exporters.

3. High Post-Harvest Losses: Vietnam faces post-harvest losses of around 25% for fruits and vegetables, equating to VND 50 trillion (USD 3.9 billion) annually. In comparison, losses in countries like India (3–3.5%) and Bangladesh (7%) are far lower, highlighting the need for improved preservation and logistics systems.

Vietnam’s cold storage market is forecast to reach USD 295 million by 2025. Total capacity is expected to grow by 70%, from 1 million pallets in 2023 to 1.7 million pallets by 2028. The fruit and vegetable sector will be a key demand driver.

According to FiinGroup, 13 new cold storage projects are planned between 2024 and 2028—signalling robust private and public investment in cold chain infrastructure.

Conclusion

Between 2020 and 2024, Vietnam has emerged as a rising force in the global frozen tropical fruit market, fueled by strong production capacity, low-cost exports, and growing international demand—especially from Thailand, the U.S., and South Korea. Strategic government support and the identification of key fruit crops have helped align production with export priorities.

However, infrastructure bottlenecks—especially in logistics and cold chain storage—continue to constrain Vietnam’s full potential. With cold storage capacity set to grow 70% by 2028 and continued investment in processing and preservation technologies, Vietnam is on a clear path to enhance its global competitiveness, reduce post-harvest losses, and increase value-added exports. The country’s position as a leading supplier of frozen tropical fruits in Asia is no longer emerging—it is being firmly established.

See more:

  • China – ASEAN – US Trade 2025: Rebalancing Import, Export and Investment Flows
  • Analysis of Vietnam’s Export Performance in H1/ 2025: Strong Growth and Positive Structural Shifts


July 22, 2025 0 comment
0 FacebookTwitterLinkedinWhatsapp
Market Insights

China – ASEAN – US Trade 2025: Rebalancing Import, Export and Investment Flows

by Henry Truong July 16, 2025
written by Henry Truong

How did China’s exports perform in the first 5 months of 2025?

Despite a 10% drop in exports to the United States during the first five months of 2025 due to tariff policies, China’s overall exports still rose by 7.2%. This growth highlights a strategic pivot, as the US, once China’s primary market, has been increasingly offset by other regions. Significant investment in Germany’s Hamburg port, for instance, has facilitated an 8% increase in China’s exports to Europe, with a nearly 12% rise to Germany specifically.

Southeast Asia has emerged as China’s second-largest trading region over the past five years, driven by its large population and strategic location. In the first five months of 2025, China’s exports to Southeast Asia reached $3.245 trillion, a 14.3% increase year-on-year. Imports from the region also grew by 2.3% to $1.895 trillion.

Within Southeast Asia, Vietnam, Thailand, and Indonesia saw the strongest export growth from China. Exports to Vietnam surged by 21%, to Thailand by 23.4%, and to Indonesia by 16.6%. While China’s imports from Thailand and Indonesia also increased by 10% and 9.3% respectively, imports from Vietnam to China declined by 4%. This decline is the steepest among China’s major Asian trading partners, contributing to a widening trade surplus favouring China and increasing Vietnam’s economic reliance on its northern neighbour.

Thailand’s Export Turnover To China In 6 Months Of 2025

During January–May 2025, Thailand’s exports to China reached 576,745 million baht, marking a significant 20.26% increase year-on-year. This growth was driven by several key product categories.

The top export products from Thailand to China included:

  • Computers, Equipment and Components: accounting for a 17% market share and showing a 20% increase.
  • Fruits: with a 15% market share, though experiencing an 18% decrease.
  • Wood Products: holding a 10% market share and demonstrating strong growth of 64%.

Beyond these top three, other Thai products that saw robust export growth to China were:

  • Copper and Copper Products: with a 3.58% market share, increasing by 23%.
  • Aluminum Products: with a 1.77% market share, soaring by 47.84%.
  • Wheat Products and Other Processed Food: with a 1.41% market share, showing an impressive 175% increase.

Vietnam’s Export Turnover To China In 6 Months Of 2025

In the context of Vietnamese exports to China, certain commodity groups have demonstrated significant growth, while others have experienced notable declines.

Fastest Growing Commodity Groups (January-May 2025)

  • Computers, electronic products and components: Reached $8.2 billion, up 36%. This highlights Vietnam’s growing role in the electronics supply chain.
  • Other machinery, equipment, tools and spare parts: Reached $2.3 billion, up 46%. This indicates increasing demand for Vietnamese-made industrial components.
  • Rubber: Reached $892.5 million, up 24%.
  • Cashew nuts: Reached $525.57 million, up 44.86%.
  • Rice: Reached $226 million, up 80%. This substantial increase points to strong demand for Vietnamese rice in the Chinese market.
  • Coffee: Reached $129 million, up 24.55%.
  • Toys, sports equipment and parts: Reached $76.77 million, up 32%.

Fastest Declining Commodity Groups (January-May 2025)

  • Cameras, camcorders and components: Reached $1.7 billion, down 28%.
  • Vegetables and fruits: Reached $1.6 billion, down 24%. This decline, particularly in agricultural products, may be attributed to stricter import requirements from China.
  • Wood and wood products: Reached $875.8 million, down 16.58%.
  • Plastic raw materials: Reached $116 million, down 38.72%.
  • Paper and paper products: Reached $94.6 million, down 50%. This severe drop indicates a significant contraction in demand or a shift in supply sources.

Import Turnover From China In The First 6 Months Of 2025 from Vietnam

Vietnam’s imports from China saw a substantial increase in the first six months of 2025, reaching $84.7 billion, a 26.4% rise compared to the same period last year. This makes China Vietnam’s largest import market, accounting for approximately 40% of Vietnam’s total import turnover of $212.2 billion in the first half of the year.

Fastest Growing Import Commodity Groups from China (January-June 2025):

  • Computers, electronic products and components: Reached $23.5 billion, up 47%. This signifies China’s crucial role as a supplier of inputs for Vietnam’s thriving electronics manufacturing sector.
  • Other machinery, equipment, tools and spare parts: Reached $17.7 billion, up 35.57%. This growth suggests increased investment in Vietnam’s industrial and manufacturing capabilities.
  • Plastic products: Reached $3 billion, up 31%.
  • Other base metal products: Reached $1.8 billion, up 54%.
  • Other base metals: Reached $1.75 billion, up 37.68%.
  • Automobile components and spare parts: Reached $969.7 million, up 78%. This considerable increase points to a growing automotive assembly and manufacturing industry in Vietnam.
  • Electric wires and cables: Reached $1.48 billion, up 54%.
  • Complete automobiles of all kinds: Reached $746 million, up 64%. This robust growth indicates rising demand for imported vehicles in Vietnam.

Fastest Declining Import Commodity Groups from China (January-June 2025):

  • Iron and steel of all kinds: Reached $2.8 billion, down 23%. This contraction could be due to increased domestic production or diversification of import sources for these materials.
  • Glass and glass products: Reached $446 million, down 22%.
  • Animal feed and raw materials: Reached $166 million, down 22%.
  • Other means of transport and spare parts: Reached $99.4 million, down 38%. This significant decrease suggests a shift in sourcing or reduced demand in this category.

Why is ASEAN attracting so much foreign investment despite a global FDI slowdown?

Despite a significant global downturn in foreign direct investment (FDI), the ASEAN region has shown remarkable resilience, attracting substantial foreign capital. While global FDI flows decreased by 2% to $1.3 trillion in 2023 and are projected to fall further by 11% to $1.5 trillion in 2024 due to trade tensions, geopolitical fragmentation, and economic volatility, ASEAN has emerged as a bright spot, demonstrating consistent growth in investment inflows.

In stark contrast, the ASEAN region has demonstrated remarkable resilience, continuing to attract substantial foreign investment. In 2023, FDI inflows to ASEAN countries reached a record $230 billion, followed by a 10% increase to $225 billion in 2024. This marks the third consecutive year of growth despite the global economic downturn, cementing ASEAN’s position as a key growth pole in the global economy. This stability has attracted strong foreign investment, including from China, which is actively seeking reliable growth opportunities and portfolio diversification away from more volatile markets.

The resilience has drawn significant foreign investment, including from China, which seeks reliable growth opportunities and portfolio diversification away from more volatile markets. China was the third-largest source of FDI in ASEAN in 2023, with investments totalling $17 billion, a nearly 20% year-on-year increase. Chinese investment in ASEAN is on an upward trend, rising from less than $4 billion in 2010.

ASEAN – A Strategic Destination for China’s Foreign Investment

Chinese firms are increasingly expanding their footprint in ASEAN, particularly in digital industries, advanced technology, and manufacturing. This move is driven by a search for new markets, less intense competition than in China, and the benefits of the ASEAN-China Free Trade Area. Notable investments include those in electric vehicles, batteries, and other allied industries, as seen in Malaysia, and electronics in countries like Malaysia and Vietnam.

The “China+1” strategy, where foreign investors diversify supply chains by investing in ASEAN alongside China, has also contributed to this trend. Chinese companies themselves are relocating manufacturing to Southeast Asia to mitigate geopolitical risks and tariff barriers. This dynamic is leading to distributed supply chains across the region, with countries like Vietnam and Indonesia seeing rapid export growth and substantial FDI, particularly in manufacturing.

While China’s overall FDI inflows have seen a significant decline in recent years, reflecting global economic uncertainties and de-risking efforts by some foreign enterprises, its outbound investment, particularly to ASEAN, remains robust. This strategic pivot highlights ASEAN’s growing importance as a key growth pole in the global economy and a crucial destination for Chinese outbound direct investment.

Vietnam’s Growing Appeal in the First Half of 2025

  • Vietnam has emerged as a particularly attractive destination for FDI within ASEAN. In the first six months of 2025, Vietnam successfully attracted FDI from 92 countries and territories, totalling $21.495 billion (derived from Singapore’s share and total investment).
  • Singapore remains the leading investor, with over $4.6 billion, accounting for more than 21.4% of Vietnam’s total FDI. However, this represents a 24.8% decrease compared to the same period last year.
  • South Korea surged into second place, investing over $3 billion, which is nearly 14.3% of the total and double their investment from the same period last year. Notably, South Korea also led in the number of capital adjustments (18.5%) and GVMCP (Government-to-Government, Ministry-to-Ministry, or Company-to-Company) transactions (26.5%).

Other significant partners include China ($2.55 billion), Japan ($2.15 billion), and Malaysia ($1.59 billion). China’s investment in Vietnam notably increased by nearly 50% year-on-year, second only to South Korea in growth rate. Furthermore, China led in the number of new investment projects, accounting for 30.1%, primarily focusing on the processing and manufacturing industry.

Foreign direct investment realized in the first 6 months of 2021-2025 in Vietnam (billion USD)

ASEAN nations are currently navigating a delicate “balancing act” as they contend with intensifying power competition between the United States and China. The goal is to maintain neutrality while simultaneously attracting beneficial investment from both global powers.

One significant challenge for ASEAN is the increasing global scrutiny of China’s outward foreign direct investment (FDI). Recent cases of delayed or blocked Chinese investments in countries like the UK, US, Czech Republic, and Niger highlight a growing trend: host countries are raising concerns about national security, labor violations, or unfair subsidies. This signals that Chinese companies can no longer expect automatic acceptance or an open-door policy in every market, a shift from past practices.

Another pressing economic concern for ASEAN is the substantial influx of cheap goods from China, often facilitated by e-commerce platforms. This surge of affordable imports negatively impacts domestic employment and manufacturing across ASEAN, rendering some local industries virtually uncompetitive. The pressure is particularly severe in sectors where China possesses a significant comparative advantage due to its advanced technological capabilities and large-scale production. A serious risk for ASEAN is the potential for premature deindustrialisation if the region becomes overwhelmed by Chinese imports, thereby hindering the development of nascent domestic industries. This phenomenon has been observed in Indonesia, where industries like textiles have been severely affected, leading to job losses and factory closures. Similarly, Thailand has implemented measures like a 7% VAT on imported goods below $40 to curb the influx of cheap imports and protect local manufacturers. Vietnam is also seeing a massive volume of small-value orders from China via e-commerce platforms, prompting authorities to consider removing VAT exemptions to prevent tax loss and safeguard domestic producers.

See further:

  • Analysis of Vietnam’s Export Performance in H1/ 2025: Strong Growth and Positive Structural Shifts
  • US Container Imports Show Modest Rebound in June 2025 Amidst Trade Tensions
July 16, 2025 0 comment
0 FacebookTwitterLinkedinWhatsapp
Market InsightsVietnam Market

Analysis of Vietnam’s Export Performance in H1/ 2025: Strong Growth and Positive Structural Shifts

by Henry Truong July 14, 2025
written by Henry Truong

According to data from the General Department of Vietnam Customs, Vietnam’s export turnover in the first half of 2025 reached an impressive USD 219.86 billion, an increase of 14.5% compared to the same period in 2024. In June alone, exports reached USD 39.52 billion, a slight decrease of 0.2% from May but still reflecting a strong upward trend. The export structure shows significant expansion in both product groups and markets, indicating a robust recovery and sustained growth in the external sector.

Which sectors are driving Vietnam’s export growth?

1. Manufacturing and Processing – The Main Growth Engine

Manufacturing and processing continues to be the primary engine of Vietnam’s export growth, contributing over 80% of the total export value. This sector’s strong performance is a key factor in the country’s overall export success.

  • Computers, electronics, and components reached USD 47.7 billion (+40%), becoming the top export product. Major markets include the U.S., China, South Korea, and the Netherlands.

  • Machinery and equipment reached USD 26.9 billion (+15.4%), growing strongly in markets such as the U.S., Germany, and South Korea.

  • Phones and accessories reached USD 26.9 billion, slightly down 0.9%, mainly due to a slowdown in demand from the U.S. and Europe.

  • Textiles and garments recorded USD 18.67 billion (+12.3%), recovering well in the U.S., Japan, and EU markets.

  • Footwear exports totaled USD 11.89 billion (+10.1%), with consistent growth in the U.S., Belgium, and Germany.

  • Toys and sporting goods witnessed a surprising boom, increasing 103.4% to USD 3.3 billion, thanks to rising demand from the U.S. and Asia.

2. Agricultural and Seafood Exports: Recovering and Breaking Through

  • Coffee exports surged to USD 5.4 billion, up 66.2%, becoming a standout in agricultural exports.

  • Cashew nuts reached USD 2.35 billion, up 19.8%, recovering well in the U.S. and EU.

  • Seafood earned USD 5.11 billion, up 15.9%, especially strong in the U.S., EU, and South Korea.

  • Rubber reached USD 1.29 billion, up 16.2%, with both volume and prices increasing.

  • In contrast, rice exports dropped 15.4% to USD 2.44 billion, mainly due to falling prices and intense competition from India and Thailand.

  • Pepper rose 33.9% in value, although quantity slightly declined.

3. Raw Materials, Mining & Energy: Sluggish Performance

  • Crude oil fell sharply by 37.5%, reaching only USD 653 million.

  • Petroleum products dropped 54.8%, reflecting weaker global demand and volatile prices.

  • Steel and iron fell 22.5%, affected by falling global steel prices and trade barriers in Europe.

  • However, some commodities showed mild recovery, such as clinker & cement (+4.4%) and coal (+5.6%).

Which countries are Vietnam’s biggest export markets?

Key Markets Showing Strong Growth

  • 🇺🇸 The United States remains Vietnam’s largest export market with USD 70.91 billion, up USD 15.6 billion year-over-year. Major exports include electronics, textiles, wood products, and agricultural goods.

  • 🇨🇳 China: Exports reached USD 29.1 billion, rising USD 11.2 billion, led by computers, electronic components, rubber, and seafood.

  • 🇰🇷 South Korea: Up by USD 10.3 billion, reaching USD 13.7 billion, with strong exports in machinery, electronics, and textiles.

  • 🇯🇵 Japan: Reached USD 11.2 billion, up USD 9.1 billion, remaining a stable market for machinery, consumer goods, and foodstuffs.

  • 🇮🇳 India: Made a significant comeback, reaching USD 5 billion, up 5.9%, driven by electronics, steel, and agro-exports.

EU and Emerging Markets Also Expanded

  • 🇳🇱 Netherlands: Recorded USD 6.25 billion, up USD 6.1 billion, acting as a logistics hub for Vietnamese goods into the EU.

  • 🇦🇪 UAE: Saw an increase of nearly USD 1 billion, especially in phone and coffee exports.

  • Other promising markets include 🇧🇷 Brazil, 🇦🇺 Australia, 🇵🇱 Poland, and 🇲🇽 Mexico, reflecting the effectiveness of Vietnam’s market diversification strategy.

Markets with Declining or Flat Exports

  • Some markets showed a slight decline, including:

    • Middle East: 🇮🇷 Iran, 🇮🇶 Iraq, 🇮🇱 Israel

    • Europe: 🇫🇮 Finland, 🇳🇴 Norway

    • Latin America: 🇨🇴 Colombia, 🇵🇪 Peru

These drops are mainly due to political instability, currency constraints, or weakening consumer demand.

Summary:

The first half of 2025 marks a strong and stable recovery for Vietnam’s export sector, with 14.5% growth in total turnover. Electronics, machinery, textiles, and agricultural products are driving this upward trend, while the export structure shows diversification and resilience.

See more:

  • US Container Imports Show Modest Rebound in June 2025 Amidst Trade Tensions
  • Overview of Vietnam Cashew Market in the First 6 Months of 2025
  • Vietnam’s Exports Grow 10.6% in Q1/2025
July 14, 2025 0 comment
0 FacebookTwitterLinkedinWhatsapp
Market InsightsOthers

US Container Imports Show Modest Rebound in June 2025 Amidst Trade Tensions

by Henry Truong July 12, 2025
written by Henry Truong

What happened with US container imports in June 2025?

In June 2025, US container imports saw a modest rebound, reaching 2,217,675 twenty-foot equivalent units (TEUs). This represented a slight 1.8% increase from May, indicating a return to stability after a turbulent period. Despite this monthly uptick, the volume remained 3.5% lower than June 2024, underscoring ongoing challenges within the global supply chain.

This modest growth occurs as US importers navigate ongoing trade volatility. The impending expiration of tariff suspensions on July 9, coupled with the US-China 90-day trade truce ending August 10, is creating considerable pressure. Additionally, the forthcoming repeal of the de minimis exemption for low-value imports from all nations further complicates import strategies.

Shifting Port Dynamics and Easing Congestion

Port market share dynamics saw significant shifts in June. The top five West Coast ports experienced a robust resurgence, capturing 45.4% of total import volumes, their highest share since January. Conversely, the top five East Coast and Gulf Coast ports saw their share decline to 38.7%, reversing May’s temporary gains.

Crucially, port congestion improved notably nationwide. This indicates an easing of pressure that followed temporary bottlenecks in May, promising better supply chain performance.

China Market: Declining Share Persists Despite Slight Monthly Uptick

In June 2025, U.S. imports from China reached 639,300 TEU, a modest 0.4% increase from May. However, this volume remained a sharp 28.3% lower year-over-year, continuing the steep decline initiated in May due to tariff hikes. This significant drop followed a surge of pre-tariff imports in April, as importers expedited cargo ahead of new duties. China’s share of total U.S. imports fell to a four-year low of 28.8% in June, well below its July 2024 peak of 40.0%. This shift reflects an ongoing diversification of supply chains towards Southeast Asia and other regions.

Global trade conditions remain strained. Red Sea disruptions persist, exacerbated by the Iran-Israel conflict, leading to costly re-routing and extended transit times. Simultaneously, ongoing trade negotiations complicate supply chain planning. Businesses must remain agile, closely monitor geopolitical developments, and enhance supply chain resilience as conditions evolve.

Global Trade Remains Tense and Volatile

Global trade continues to face significant challenges. Red Sea disruptions persist, now worsened by the Iran-Israel conflict. This forces costly and time-consuming rerouting of shipping routes. Meanwhile, ongoing trade negotiations create uncertainty, further complicating supply chain planning for businesses.

In this volatile environment, businesses must remain agile. They need to closely monitor geopolitical developments and enhance supply chain resilience to adapt to constantly changing market conditions.

Import Trends from Top Countries: Vietnam Stands Out

In June 2025, total U.S. container imports from the top 10 countries of origin saw a slight 1.3% increase from May, adding 19,544 TEU. While China’s contribution rose a modest 0.4%, several Southeast Asian nations recorded much stronger growth. This highlights the ongoing diversification of U.S. supply chains.

Vietnam led this growth, showing an impressive 7.7% increase over May, adding 19,516 TEU. Indonesia followed with a 17.3% surge, and Thailand grew by 8.6%. Italy also saw a notable 9.0% increase. These figures strongly reinforce the shift towards alternative sourcing strategies away from China.

However, import volumes from several other major trading partners significantly weakened. South Korea and India experienced sharp declines of 12.5% and 9.6%, respectively. Japan’s imports fell by 3.0%. Conversely, imports from Germany and Taiwan each saw a slight 2.6% rise. These fluctuating import volumes underscore the ongoing restructuring of global trade, as U.S. businesses adapt to evolving tariff changes and cost pressures.

U.S. Ocean Port Performance: West Coast Regains Momentum

In June 2025, container volumes at the top 10 U.S. ports collectively increased 3.1% month-over-month, adding a net of 55,733 TEUs. This growth was predominantly driven by the West Coast, where major ports showed a strong recovery in import volumes.

Specifically, Los Angeles experienced a significant 29.1% increase (up 103,884 TEUs). Long Beach followed suit with an 18.8% rise (up 58,492 TEUs), and Tacoma saw a remarkable 33.3% surge (up 16,142 TEUs). These figures reflect a notable shift in port market share towards the West Coast.

However, most other major U.S. ports recorded declines. Savannah suffered the largest drop at 16.9%, followed by Houston (-15.8%), Charleston (-14.8%), and Norfolk (-14.3%). Volumes at New York/New Jersey also decreased by 3.3%. This mixed performance underscores the ongoing changes in port routing and regional demand, with leading West Coast gateways capturing a larger share of import volumes in June.

This shift indicates that U.S. businesses are actively adjusting their logistics strategies in response to evolving trade conditions and tariff landscapes.

Imports from China: The Widespread Impact of Trade Policy

In June 2025, total U.S. imports from China reached 639,300 TEU. While this was nearly unchanged from the previous month (up 0.4%), it represented a sharp 28.3% year-over-year decline. China’s share of total U.S. container imports hit a four-year low of 28.8% in June, clearly reflecting the persistent impact of tariff increases.

The top import categories from China in June included:

  • Furniture & Bedding (HS-94): 96,347 TEU
  • Plastics (HS-39): 87,454 TEU
  • Nuclear Reactors & Boilers (HS-84): 66,152 TEU

However, even these leading categories experienced significant year-on-year drops: furniture was down 36.9%, nuclear reactors fell 31.8%, and plastics saw a 17.6% decrease compared to June 2024.

Other key categories also saw substantial declines. Electrical Machinery (HS-85) dropped 33.7%, Toys, Games & Sporting Goods (HS-95) fell 27.1%, and Vehicles (HS-87) decreased 31.7% year-on-year. Even traditionally stable sectors like Textiles (HS-63), Apparel (HS-61, HS-62), and Footwear (HS-64) experienced reductions of more than 18–29%.

This broad-based decline underscores the far-reaching impact of U.S. trade policy. While importers seem to be slowly adjusting their supply chains as tariffs remain high and diversification continues, China’s share of U.S. imports could remain under pressure through the second half of 2025. This is especially true as the broad tariff moratorium expires on July 9, potentially triggering a second wave of price increases before the U.S.-China trade truce ends on August 10. Additionally, the new 40 percent U.S. tariff on re-exports from Vietnam—aimed at curbing the transshipment of Chinese products—further complicates alternative sourcing strategies, adding long-term pressure to volumes originating from China.

See further: Global Ocean Shipping in Crisis: How US-China Trade Tensions Are Reshaping the Industry

Why are Vietnam’s exports to the US increasing?

Why are Vietnam’s exports to the US increasing?

Vietnam’s exports to the U.S. surged by an impressive 28.61% in June 2025 compared to the previous year, standing out amidst broader volatility in the U.S. container import market. This remarkable growth is primarily attributed to Vietnamese manufacturers proactively increasing production ahead of impending tariff deadlines and a significant influx of Foreign Direct Investment (FDI), which together are solidifying Vietnam’s crucial role in the evolving global supply chain.

A key factor in this impressive growth was the strategic decision by Vietnamese enterprises to accelerate operations prior to the July tariff deadline and in anticipation of a new trade agreement with the U.S. This proactive stance highlights Vietnam’s adaptability and foresight in navigating the complexities of international trade policy.

FDI Fuels Production Capacity Expansion

Vietnam continues its strong appeal for foreign direct investment. Total registered FDI capital increased by 32.6% to $21.51 billion in the first half of 2025. Critically, disbursed FDI capital also saw an 8.1% rise, reaching $11.72 billion over the same period last year. This consistent flow of capital underscores international investors’ confidence in Vietnam’s business environment and signifies a substantial expansion of the nation’s production capacity. This expansion provides a robust foundation for Vietnam to meet growing market demand, particularly from key partners like the United States.

The allocation of disbursed FDI clearly prioritizes key manufacturing industries:

  • Processing and manufacturing remained the dominant sector, attracting $9.56 billion, accounting for a significant 81.6% of total realized FDI. This reinforces its pivotal role in driving Vietnam’s economic growth and enhancing its production capabilities.
  • Real estate business secured the second-highest share with $932.2 million, representing 8.0%.
  • Electricity, gas, hot water, steam, and air conditioning supply attracted $444.7 million, making up 3.8%.

As of June 30, 2025, total registered foreign investment, encompassing new, adjusted, and capital contribution/share purchase, reached $21.52 billion, reflecting a 32.6% increase year-on-year.

Diversified Investment Sources Bolster Vietnam’s Position

Among the 72 countries and territories with newly licensed investment projects in Vietnam during the first six months of 2025, Singapore led the way with $2.41 billion, accounting for 25.9% of the total newly registered capital. China followed closely with $2.13 billion, representing 22.9%.

Other significant investment partners included:

  • Sweden: $1.0 billion (10.8%)
  • Japan: $832.3 million (9.0%)
  • Taiwan (China): $725.8 million (7.8%)
  • Hong Kong (China) SAR: $691.9 million (7.4%)
  • British Virgin Islands: $317.0 million (3.4%)

These figures collectively demonstrate Vietnam’s increasing attractiveness as a foreign investment destination, particularly in the manufacturing and processing sectors. The steady and strong growth in FDI inflows is poised to remain a crucial driving force for Vietnam’s sustainable economic development in the long term, further solidifying its strategic importance in the global value chain.

Vietnam’s Key Export Sectors Witness Remarkable Growth to the U.S.

Vietnam’s merchandise exports to the United States in the first six months of 2025 showcased impressive growth across numerous commodity groups. This performance reaffirms the diversity and increasing competitiveness of Vietnamese products in the global market.

Notable highlights of this export surge include:

  • Vegetables: Reaching $261.6 million, an increase of 66%.
  • Coffee: Valued at $333.6 million, with a significant 76.43% rise.
  • Rice: Totaling $19 million, up 45.71%.
  • Rubber: Generating $23.9 million, a 52% increase.
  • Rubber products: Bringing in $322 million, growing by 59%.
  • Computers, electronic products, and components: Leading the charge at $18.5 billion, a substantial 65% increase.
  • Electrical wires and cables: Amounting to $721 million, up 68%.
  • Toys, sports equipment, and parts: Reaching $2.291 billion, an astonishing 217% increase.

The outstanding growth in high-tech industries like Computers, electronic products, and components (up 65%) and consumer goods like Toys, sports equipment, and parts (up 217%) signifies Vietnam’s burgeoning role as a critical manufacturing hub. The explosive growth in the toy and sports equipment sector, in particular, vividly demonstrates Vietnam’s increasing ability to absorb production shifts from other countries within the global supply chain, especially in response to evolving trade policies.

These positive figures not only solidify Vietnam’s position as an important trade partner for the United States but also underscore the vast potential of the Vietnamese economy to adapt and thrive in a challenging global economic environment. Vietnam is effectively leveraging its expanding production capacity and attractive FDI inflows to capitalize on the ongoing supply chain diversification trend.

See more: Vietnam’s Exports Grow 10.6% in Q1/2025

July 12, 2025 0 comment
0 FacebookTwitterLinkedinWhatsapp
Food & Spicy Industry

Overview of Vietnam Cashew Market in the First 6 Months of 2025

by Henry Truong July 9, 2025
written by Henry Truong

Vietnam’s Cashew Nut Imports Surge in First Half of 2025: Volume Hits 1.6 Million Tons, Value Exceeds $2.49 Billion

In the first six months of 2025, Vietnam imported approximately 1.6 million tons of raw cashew nuts, with the total import value surpassing USD 2.49 billion. This marks a significant increase compared to the same period in 2024, with import volume rising by 7.1% and import value jumping by 38.1%. Notably, the total import value in just the first five months of 2025 already exceeded the entire annual import value of 2024, which stood at USD 1.07 billion. This sharp growth underscores the booming demand for raw materials in Vietnam’s cashew processing industry.

Cambodia remained Vietnam’s leading supplier, accounting for 65.71% of total import volume and 60% of total import value during this period. Despite a 19% year-on-year increase in average price, cashew imports from Cambodia remained competitively priced, second only to Nigeria in affordability.

Tanzania emerged as the second-largest supplier, offering premium-quality cashews at the highest average prices among major exporters. This reflects the country’s structured auction system and consistently high-grade raw cashews.

Meanwhile, Nigeria maintained its position as a key low-cost supplier, delivering the most affordable raw cashew nuts to Vietnam. Its pricing strategy continues to support the growing demand for bulk, cost-efficient processing within the Vietnamese cashew industry.

What were the raw cashew price trends in Vietnam during the first half of 2025?

During the first half of 2025, domestic raw cashew nut prices in Vietnam experienced fluctuations, starting high in the early harvest season (January–February 2025) at an average of around VND 40,000 per kilogram—approximately VND 10,000/kg higher than the same period in 2024. Prices then moderated as the harvest progressed, reflecting changes in supply and demand across key growing regions.

On January 10 and 17, raw cashew prices in major growing provinces were as follows:

  • Binh Phuoc: VND 25,000 – 27,000/kg
  • Dong Nai: VND 24,500 – 26,500/kg
  • Dak Lak: VND 21,000 – 25,000/kg
  • Gia Lai: VND 24,500 – 26,000/kg
  • Dak Nong: VND 25,000 – 26,000/kg

In Binh Phuoc, the country’s leading cashew-growing province, average prices at the start of the season ranged between VND 40,000 – 45,000/kg.

As the harvest progressed into the mid-season (February–April 2025), increased supply from several provinces caused prices to ease slightly, stabilising around VND 33,000 – 35,000/kg.
On March 14 and 24, average prices were reported as:

  • Dak Lak: VND 44,000/kg
  • Dak Nong: VND 43,000/kg
  • Gia Lai: VND 41,000/kg
  • Kon Tum: VND 42,500/kg
  • Lam Dong: VND 42,000/kg

By March 28, prices began to soften slightly:

  • Dak Lak and Dak Nong: VND 42,000/kg
  • Gia Lai: VND 39,000/kg
  • Kon Tum: VND 40,500/kg
  • Lam Dong: VND 40,000/kg

However, by April 2, prices had rebounded to mid-March levels.
In Binh Phuoc, the average mid-season price stood at VND 35,000 – 42,000/kg in February–March, gradually declining to VND 30,000 – 38,000/kg by March–April.

Prices further moderated by the end of the harvest season (April–May 2025). In early May, fresh cashew nuts in Binh Phuoc were trading between VND 29,000 and 30,000/kg, with the average end-of-season price ranging from VND 28,000 to 32,000/kg.

For a comprehensive analysis with full data tables and insights, refer to the full report: Vietnam Cashew Nuts Import–Export Market Report 2025

How did Vietnam’s cashew nut exports perform in the first half of 2025?

In the first six months of 2025, Vietnam’s cashew nut exports demonstrated a strategic shift towards value-driven growth, achieving an estimated export value of USD 2.347 billion despite a slight 3.3% decline in export volume to 344,640 tons compared to the same period in 2024. This impressive 19.6% increase in value was primarily driven by a significant 23.8% year-on-year rise in average export prices, reaching USD 6,805.4 per ton, highlighting the industry’s focus on higher-value products.

China emerged as Vietnam’s largest cashew export market in the first half of 2025. The country imported approximately 83,000 tons of cashew nuts from Vietnam, worth USD 525.56 million, accounting for 22% of Vietnam’s total cashew export value. This marked a 21.7% increase in volume and a 41.2% increase in value compared to the same period last year. Notably, May 2025 saw the highest volume of cashew exports to China in three years, with 24,620 tons exported at a value of USD 156.39 million, up 44.4% in volume and 67% in value compared to May 2024. In April 2025, China had already become Vietnam’s top cashew buyer, with 23,750 tons imported at USD 149.1 million—an increase of 126.7% in volume and 129.8% in value over the previous month. Compared to April 2024, these figures were up 74.4% in volume and 113% in value. The average export price to China in May was USD 6,350 per ton, with the six-month average reaching USD 6,323 per ton.

The United States, which was previously the largest importer of Vietnamese cashews, fell to second place. In the first half of 2025, the U.S. imported 70,000 tons of cashew nuts worth USD 457.5 million, accounting for a 20.25% market share. However, this represented a 24% decline in volume and a 6.39% decline in value year-on-year. During the same period, U.S. imports of cashew nuts from Ivory Coast increased by 27% in both volume and value. While Vietnam still supplies 98% of the U.S. cashew imports, rising tariffs and disruptions related to the Red Sea conflict have prompted American importers to diversify their sources. On Vietnam’s side, there is also a strategic intent to reduce dependence on the U.S. market.

Despite strong export growth, the industry recorded a rare trade deficit. In the first six months of 2025, Vietnam imported USD 2.49 billion worth of raw cashew nuts, surpassing the USD 2.347 billion in export earnings from processed cashews. This situation presents a profitability paradox for the industry. Although export prices have increased, they have not kept pace with the rising costs of raw material imports and domestic processing. As a result, the sector’s overall financial position is weakening.

This trade imbalance underscores the need for Vietnamese cashew processors to reassess their entire value chain. To improve profitability, companies must secure stable and cost-effective raw material sources, shift toward producing higher-margin value-added products such as roasted, flavored, or organic cashews, and enhance internal production efficiency.

There is already a clear trend toward more value-added products. In the first six months of 2025, the market share for roasted and flavored cashew nuts increased from 11% to 18%, while certified organic cashews rose from 7% to 9%. OEM and private-label orders remained stable, with a noticeable increase in customized requests. This strategic shift reflects the industry’s efforts to improve product quality, enhance competitiveness, and meet the growing demand in premium market segments.

Vietnam is also focusing on expanding its presence in high-potential markets. In the first half of 2025, cashew exports to the UAE rose by 19% in volume and 47% in value, while exports to the Netherlands grew by 25% in value. These developments demonstrate the country’s efforts to diversify its export destinations and strengthen its foothold in markets that value high-quality, differentiated cashew products.

For a comprehensive analysis with full data tables and insights, refer to the full report: Vietnam Cashew Nuts Import–Export Market Report 2025


July 9, 2025 0 comment
0 FacebookTwitterLinkedinWhatsapp
Food & Spicy IndustryMarket InsightsVietnam Market

Coffee Market Week 1/7 – 7/7/2025: Vietnam Grows Strongly, Globally Welcomes Surplus Wave

by Henry Truong July 8, 2025
written by Henry Truong

How did Vietnam’s coffee exports perform in the first half of 2025?

In the first half of 2025, Vietnam’s coffee exports showed significant growth, with June 2025 alone seeing a remarkable year-on-year increase of 63.7% in volume and 103.8% in export value, reaching 123,623 metric tons. This strong performance was driven by robust demand from key markets like the European Union (EU) and the United States. The average export price also climbed to USD 5,220 per ton, a substantial increase from the previous year, which in turn provided strong support for domestic coffee prices.

According to the Ministry of Agriculture and Environment, in the first half of 2025, Vietnam’s total coffee export volume is estimated at 953.9 thousand tons, generating approximately USD 5.45 billion in revenue. This represents an impressive 67.5% increase in value compared to the same period in 2024, despite a modest 5.3% growth in volume.

Despite the strong export performance, Vietnamese farmers are reportedly holding back significant stockpiles, with inventories estimated at only 10–15% of the current crop cycle. This tightening supply has helped stabilise domestic prices and provided a solid foundation supporting global Robusta coffee prices.

What is the coffee production outlook for Vietnam, considering weather and forecasts?

Vietnam’s coffee production outlook for the 2025/2026 crop year is currently influenced by a mix of weather conditions and conflicting forecasts. As July 2025 marks the peak of the rainy season in the Central Highlands, Vietnam’s primary Robusta-producing region, rainfall is anticipated to be 5% to 25% higher than the multi-year average, with temperatures between 25–31°C and humidity above 80%. These conditions are generally favorable for the upcoming coffee crop, potentially leading to a more positive harvest.

During the 2024/2025 crop year, Vietnam experienced adverse effects from climate change and El Niño, resulting in prolonged drought throughout 2024. This led to a 15–20% decline in yields, causing coffee export volumes to drop compared to previous seasons, despite an increase in export value due to higher prices.

Production Forecast

According to the USDA, Vietnam’s total coffee production for the 2025/2026 crop year is projected to reach 31 million bags, including 30 million bags of Robusta and 1 million bags of Arabica—a 6.9% increase over the previous season.

The USDA has maintained its estimate for the 2024/2025 crop year (Oct 2024 – Sep 2025) at 29 million bags (28 million Robusta). However, the Vietnam Coffee-Cocoa Association (VICOFA) offers a more conservative outlook, estimating the 2024/2025 output at just 26.5 million bags, or potentially as low as 22 million bags.
This significant discrepancy between USDA and VICOFA projections is a key factor driving short-term volatility in Robusta prices. If VICOFA’s lower estimates prove more accurate, the tight supply in 2024/2025 will continue to support Robusta prices in the near term.

Detailed Price List By Day In Coffee Growing Regions In Vietnam From July 1st – 7th, 2025 (Unit Price: 1,000 VND)

Why are Robusta coffee futures declining globally?

Global Robusta coffee futures have been experiencing significant downward pressure from mid-June to early July 2025, extending a bearish trend that has lasted for several months. For instance, the July 2025 contract on ICE Futures Europe saw a sharp $500/ton correction, falling from approximately $4,121/ton on June 15 to $3,615/ton by July 3. The most notable decline occurred around June 17, when prices plummeted nearly $300/ton, pushing Robusta futures to their lowest point in over 15 months, primarily due to an improving global supply outlook.

Bearish Drivers: Brazil and Indonesia Lead the Oversupply Narrative

The primary catalyst for the decline is Brazil’s accelerating Robusta harvest. As of late June, 23.4% of Brazil’s Robusta crop had been harvested, with reports of 49% completion earlier in the month. The strong pace and high yields have injected significant volume into global markets. Adding to the pressure, Indonesia—another key Robusta producer—has begun releasing fresh supply, reinforcing oversupply concerns.

Although Arabica harvest progress was slightly delayed—Cooxupé, Brazil’s largest coffee cooperative, reported only 31% completion by June 27, compared to 42% last year—the bearish mood prevailed. The USDA projects Brazil’s total 2025/26 coffee output at 65 million bags (+0.5% YoY), with Robusta production rising 14.76% to 24.1 million bags, while Arabica falls 6.4% to 40.9 million bags. Favorable weather, especially in Minas Gerais where rainfall in June reached 714% of the historical norm, has further lifted crop prospects.

Global Outlook: Production Surplus Builds, But Stock Levels Remain Tight

Globally, the USDA forecasts coffee production to hit a record 178.68 million bags in 2025/26 (+2.5% YoY), including 81.66 million bags of Robusta (+7.9%). Consumption is estimated at 169.4 million bags, suggesting a surplus of 9.32 million bags. However, with global inventories still low at just 22.8 million bags—well below the long-term average—experts caution that sustained surpluses will be needed over multiple seasons to fully rebuild stock levels.

In the short term, the prospect of oversupply, led by Brazil and Indonesia, continues to weigh heavily on Robusta futures. Yet, tight inventories and climate-driven uncertainty in key producing countries like Vietnam could inject volatility, especially if production shortfalls materialise later in the year.

Speculative Positioning Adds Complexity to Robusta Price Narrative

Despite the prevailing bearish trend in Robusta coffee futures, speculative behaviour presents a more nuanced picture. According to the Commitment of Traders (CoT) report dated June 10, 2025, the Managed Money sector increased its net long position by 17.7%, reaching 3,506 lots. This shift suggests that not all investors are aligned with the prevailing downside momentum.

While the broader market narrative centers on “speculative selling” driving prices lower, the increase in long positions indicates that some sophisticated funds are engaging in opportunistic counter-trend strategies—buying into weakness in anticipation of a rebound. This divergence may reflect differing risk appetites or time horizons among investor classes, and highlights that speculative sentiment is not uniformly bearish.

In short, while Robusta prices remain under pressure due to abundant supply—particularly from Brazil and Indonesia—the CoT data reveals that parts of the market see current price levels as attractive entry points. This adds an undercurrent of speculative support that could limit further downside or trigger volatility if supply expectations shift.

What is the forecast for Vietnam’s domestic coffee prices in July 2025?

For July 2025, Vietnam’s domestic coffee prices are projected to experience a steady increase, potentially reaching between VND 115,000–116,000/kg. This upward trend is supported by a combination of strong global and local market fundamentals, including tight global supply, low Robusta inventories on the London ICE exchange, a stable USD/VND exchange rate, and firm speculative long positions.

  • Tight global supply, with Brazil’s Robusta harvest progressing slowly.
  • Low Robusta inventories on the London ICE exchange—at multi-week lows—are providing price support.
  • A stable USD/VND exchange rate, which shields domestic prices from external currency pressure.
  • Speculative long positions remain firm, reinforcing upward price momentum.

With London Robusta hovering around USD 4,689/ton and New York Arabica near 375 cents/lb, Vietnam’s coffee prices are expected to maintain upward pressure. Farmers and exporters should stay alert to global price movements and adjust selling strategies to capture peak margins.

What is the global Robusta coffee price forecast for July 7-14, 2025?

From July 7 to July 14, 2025, Robusta futures (RMU25 contract) are anticipated to trade within a consolidation range of USD 3,450–3,600/mt. Currently, prices are hovering around USD 3,670–3,690/mt, with identified support at USD 3,589/mt and resistance at USD 3,648/mt. Should prices break below the support level, they could potentially fall to USD 3,530/mt, whereas a rebound above resistance might lead to a climb towards USD 3,707/mt.

Despite recent weakness, the global Robusta market retains a bullish undertone due to:

  • Slower Robusta shipments from Indonesia, tightening short-term supply.
  • Continued speculative buying, especially following last week’s Arabica sell-off.
  • Rising freight costs amid geopolitical tensions, adding upward pressure.

However, the rally faces headwinds:

  • Exchange inventories of Robusta have climbed to multi-month highs.
  • Forecasted production rebounds from Vietnam and Brazil in the 2025/26 crop year are capping gains.

The market remains in a transition phase, weighing short-term supply constraints against long-term recovery expectations. While a price rebound is possible, traders should anticipate volatility and prepare for potential corrections as new supply flows in.

Technical analysis suggests September Robusta (LRCU25) may hold near current levels (USD 3,677/mt) but is unlikely to break the USD 4,200–4,300/mt resistance zone without stronger bullish catalysts.

Arabica Market & Domestic Price Implications

September ICE Arabica futures are expected to trade in a narrow band of USD 2.75–2.85/lb, supported by Brazil’s seasonal harvest, low weather risks, and consistent demand from North America and Europe.

In Vietnam, domestic prices are forecast to remain high, around VND 95,800–96,400/kg, with modest gains tied to international trends. However, elevated domestic prices continue to challenge export competitiveness, as local quotes remain higher than international floor levels.

For a comprehensive analysis with full data tables and insights, refer to the full report:

July 8, 2025 0 comment
0 FacebookTwitterLinkedinWhatsapp
Market Insights

Global Ocean Shipping in Crisis: How US-China Trade Tensions Are Reshaping the Industry

by Henry Truong April 19, 2025
written by Henry Truong

How Did US-China Trade Tensions Impact Shipping Volumes in Early April 2025?

In early April 2025, US-China trade tensions led to a drastic drop in container bookings, particularly after the April 2 announcement of a 54% total tariff on Chinese imports. Data from logistics platform Vizion shows a significant contraction in global trade lanes during the first week of April (April 1–8) compared to the previous week (March 24–31), with US-China maritime routes experiencing the most severe impact.

  • Global TEU bookings fell by 49%
  • US imports dropped 64%
  • US exports decreased 30%
  • US imports from China plunged 64%
  • US exports to China declined 36%

This decline follows the April 2 announcement of a 10% baseline tariff on all US imports, combined with a 34% additional tariff on Chinese goods, effectively creating a 54% total tariff on Chinese imports.

The fallout underscores growing volatility in international trade and maritime logistics. With tariffs disrupting containerised trade flows, global supply chains now face higher costs, longer delays, and shifting alliances in the shipping industry.

What Happened to Freight Rates After the New Tariffs Were Announced?

After the new tariffs were announced, shipping costs experienced an unexpected spike just before their implementation, despite expectations that weaker demand would drive freight rates down. This brief surge in container rates was observed by April 1, 2025, across key routes.

By April 1, 2025, container rates surged:

  • China to US East Coast: up 9% to $322/FEU

  • China to US West Coast: up 16% to $383/FEU
  • Air freight from Vietnam to the US rose 8%, and from China to the US by 5%

According to Xeneta, a global freight market intelligence platform, spot container rates from the Far East to both US coasts jumped ahead of the tariff implementation. However, these same spot rates are still 43% to 49% lower than they were at the start of 2025.

“Liberation Day will not bring a sense of freedom to carriers caught in the crossfire of tariffs,” said Peter Sand, Chief Analyst at Xeneta.

Sand warned that shipping companies and US importers face major challenges in negotiating long-term freight contracts starting May 1. He noted that the ongoing uncertainty in US-China trade relations makes supply chain planning increasingly difficult.

While the tariff surge briefly inflated costs, the broader trend remains downward, with spot rates expected to continue falling due to global overcapacity and slowing trade flows.

Why Did Shipping See a ‘Frontloading’ Surge Before the Tariffs?

Shipping experienced a ‘frontloading’ surge before the tariffs because many U.S. importers strategically rushed orders in early 2025. This behavior created a sharp uptick in ocean freight bookings during Q1, as businesses aimed to beat the April 2 tariff deadline and avoid the impending higher costs.

However, once the tariffs took effect, booking volumes plummeted, signalling a rapid contraction in demand—a trend clearly reflected in recent shipping data.

Which Industries Are Most Affected by the New Tariffs?

The new tariffs are impacting various industries differently, with some sectors absorbing the shock more severely than others. Here’s a breakdown of which industries are most affected:

  • E-Commerce — Very High Impact
    Platforms like Shein and Temu are directly affected by the removal of de minimis tax exemptions for orders under $800. Their cost structure is now under intense pressure.
  • Pharmaceuticals & Medical Devices — High Impact
    These sectors prioritise speed and reliability. While they can absorb higher costs, tariffs still disrupt supply chain flows and budgeting.
  • Technology & Data Centers — High Impact
    Imports of servers, networking gear, and AI hardware have surged, with U.S. firms rushing to secure critical infrastructure before tariffs drive prices up.
  • Fast Fashion — High Impact
    With low price points and razor-thin margins, losing de minimis protections is a major blow. Tariffs could multiply landed costs, threatening profitability.
  • Toys & Games — Medium to High Impact
    Industry players like Steve Jackson Games have warned that 54% tariffs could devastate smaller manufacturers and niche brands.

How Are Shipping Lines Responding to Current Trade Challenges?

In response to escalating U.S.-China trade tensions and reduced demand from new tariffs, global shipping lines are rapidly adapting their operations. With freight volumes declining, particularly on crucial routes such as the trans-Pacific, carriers are implementing aggressive capacity management strategies to maintain efficiency and navigate the challenging environment.

1. Cancellations, Route Cuts, and Strategic Adjustments

The most immediate response has been a wave of blank sailings—scheduled voyages that are canceled to reduce excess capacity.

  • A total of 47 blank sailings have been announced, heavily concentrated on trans-Pacific and Asia-Europe trade lanes.
  • 43% of cancellations are on trans-Pacific routes, mirroring the steep drop in U.S. imports from China and broader Asia.
  • HLS Group alone has logged 80 cancellations from China, and the ONE Alliance has indefinitely suspended a major route originally set to resume in May.

2. Vessel String Reconfigurations

Shipping lines are also modifying or scrapping vessel strings—the sequence of ships operating on a given route. This helps align sailing schedules more closely with reduced demand and port congestion scenarios.

3. Subtle Capacity Controls: Slower, Smaller, Smarter

Beyond outright cancellations, carriers are turning to operational tweaks to manage excess capacity without idling fleets:

  • Slow steaming: Reducing sailing speed to stretch transit times and absorb capacity.
  • Skipping ports: Extending voyage timelines by omitting certain stops.
  • Maintenance buffering: Placing ships in dry dock under the guise of scheduled service.
  • Downsizing vessels: Using smaller ships on underperforming routes.

4. Downtime Remains Low

Despite the downturn, only 0.2% of the global container fleet is currently idle. This shows that rather than leaving ships docked, carriers are using speed reductions, route tweaks, and flexible scheduling to absorb lower volumes and maintain fleet utilisation.

What is the USTR’s Proposed $1 Million Port Charge and Its Impact?

Beyond the current economic turbulence, the shipping sector is now confronting new regulatory challenges, specifically the Office of the United States Trade Representative (USTR)’s proposed $1 million port entry charge for vessels built in China. This measure, presented as a national security initiative, aims to decrease U.S. dependence on Chinese-built ships.

But the backlash has been swift.

U.S. exporters, port authorities, and logistics unions argue the proposal would backfire, raising operating costs, disrupting trade flows, and risking domestic maritime jobs. Critics warn it could hamper U.S. exports just as shippers are already dealing with falling demand and tariff-driven uncertainty (Reuters).

Are Freight Rates Rising or Falling Amidst Trade Tensions?

Amidst ongoing trade tensions, freight pricing is experiencing complex and diverging trends, making it difficult to determine if rates are consistently rising or falling. This flux is evident through contrasting dynamics across different transport modes and even between various shipping indices.

Ocean Freight: Mixed Signals

  • The Shanghai Container Freight Index (SCFI) has fallen 17% since January 2025, and over 55% since its December 2024 peak, now hovering at stabilised, lower levels.
  • Meanwhile, the Drewry World Container Index reports a spot rate of $5,318 per 40ft container, up sharply from $1,536 a year ago.

This discrepancy suggests a split market: rising rates on specific high-demand lanes, possibly due to pre-tariff frontloading, versus a general downward trend as volumes fade.

Air Freight: Demand Surge Drives Spike

  • Global air cargo spot rates surged 37% in March alone, hitting $4.14/kg, the highest level of 2025.
  • The China–U.S. route mirrored the global average with a 37% increase, while the Europe–U.S. lane saw a smaller 7% rise to $2.61/kg.

This spike is largely driven by companies in technology, pharmaceuticals, and data infrastructure, rushing to air freight goods before tariffs took effect in April—especially on China-origin shipments.

Why Does Port Congestion Continue Even with Lower Shipping Volumes?

Despite a noticeable drop in container volumes on U.S.-bound routes, port congestion continues to persist globally. This ongoing issue suggests a fundamental mismatch between existing port infrastructure readiness and the overall fluidity of the supply chain, leading to elevated congestion levels even with reduced traffic.

  • Global port congestion exceeds 10%, with over 20 vessels waiting on average at major ports.
  • Europe is a hotspot: over 935,000 TEUs are stuck at Northern European and Mediterranean ports, making up 32% of global backlogs.

Most Severely Affected Ports:

Istanbul, Singapore, Chittagong, and Shanghai remain bottlenecks.

Specific waiting times:

    • Algiers: Improved, now 5 days (down from 7).
    • Djen-Djen: Average 3 days, peaking at 14.
    • Bejaia: Up to 8 days.
    • Cape Town: 8–10 days, affected by winds.
    • Durban: Stable at 1 day.

Bright Spots:

  • Congestion has eased at Hamburg and Rotterdam.
  • PSA Antwerp has improved flow by cutting its export delivery window by 5 days, helping streamline outbound movement.

How Are Ports and Businesses Handling Current Shipping Disruptions?

Ports and businesses are grappling with significant ongoing disruptions, primarily driven by the sharp drop in container traffic to North America. This challenge is compounded by volatile freight rates and inconsistent port congestion, collectively straining operational capabilities and strategic planning for all stakeholders.

  • Ports must adapt to shifting cargo flows, driven by changing trade patterns and route cancellations.
  • U.S. businesses are facing supply chain uncertainty, with challenges in planning inventory, managing costs, and selecting reliable logistics partners.

Adding to the complexity, negotiations for new long-term ocean contracts, effective May 1, are forcing importers to make high-stakes decisions amid unstable market conditions.

What Are the Key Takeaways for Navigating Global Shipping Adjustments?

To navigate the current era of adjustment in global shipping, it’s crucial to understand the fundamental reset triggered by U.S.–China trade tensions and new tariffs. Key takeaways for businesses and stakeholders include recognizing several dominant trends that are reshaping the industry:

  • Carriers are cutting capacity through blank sailings and slow steaming.
  • Air freight surging temporarily as shippers race to beat tariff deadlines.
  • Ocean spot rates are diverging across indices and trade lanes.
  • Port congestion is persisting in Europe, Asia, and parts of Africa despite falling volume.

Across the board, uncertainty is the dominant force, pressuring stakeholders to stay agile, rethink sourcing, and diversify logistics strategies in a volatile landscape.

April 19, 2025 0 comment
0 FacebookTwitterLinkedinWhatsapp
Market Insights

Vietnam’s Exports Grow 10.6% in Q1/2025

by Henry Truong April 11, 2025
written by Henry Truong

How did Vietnam’s total exports perform in Q1 2025?

In Q1 2025, Vietnam’s total export turnover reached USD 102.84 billion, marking a 10.6% increase compared to Q1 2024. However, the trade surplus declined to USD 3.16 billion, down from USD 7.7 billion in the same period last year, as import growth outpaced exports.

Who drives Vietnam’s exports: domestic or foreign companies?

Vietnam’s export structure continued to be led by foreign-invested enterprises (FIEs), which accounted for a dominant 71.8% of total export turnover. Specifically:

  • Domestic sector: USD 29.02 billion, up 15%, accounting for 28.2% of total exports.
  • Foreign-invested sector (including crude oil): USD 73.82 billion, up 9%, accounting for 71.8% of total exports.

This highlights the ongoing reliance on FIEs, especially in electronics and high-value manufacturing.

This highlights the ongoing reliance on FIEs, especially in electronics and high-value manufacturing.

What are Vietnam’s top export product categories?

Manufactured goods continued to be the primary catalyst for Vietnam’s export growth in Q1 2025, showcasing the nation’s strong industrial base and global competitiveness in various sectors.

  • Manufacturing and industrial products: USD 90.92 billion, accounting for 88.4% of total exports.

  • Agricultural and forestry products: USD 8.86 billion (8.6%).

  • Seafood products: USD 2.31 billion (2.3%).

Which specific products did Vietnam export the most?

Vietnam recorded 18 export items exceeding USD 1 billion in turnover, with five product categories surpassing USD 5 billion:

  1. Electronics, computers and components: USD 21.1 billion, +29.2% YoY

  2. Phones and components: USD 14.0 billion, -0.9% YoY

  3. Machinery and equipment: USD 12.4 billion, +13.6% YoY

  4. Textiles and garments: USD 8.7 billion, +11.1% YoY

  5. Footwear: USD 5.4 billion, +12.1% YoY

Among these, electronics and computers witnessed the most remarkable growth, showing strong global demand and Vietnam’s competitiveness in tech manufacturing.

Which countries are Vietnam’s biggest export markets?

The United States remained Vietnam’s largest export market, with total export value reaching USD 31.4 billion. Meanwhile, China was Vietnam’s largest import source with USD 38.1 billion, resulting in a trade deficit of USD 24.9 billion with the country.

What’s the outlook for Vietnam’s exports and what does it mean for businesses?

Vietnam’s export sector in Q1 2025 showcased remarkable resilience and sustained upward momentum, particularly within its crucial manufacturing sectors. This robust performance, coupled with the strong showing of domestic enterprises, signals an encouraging improvement in both production capacity and overall competitiveness, painting a positive outlook for the nation’s trade.

However, the narrowing trade surplus reflects rising import demand, which may pose challenges to the overall trade balance in the coming quarters. To ensure sustainable growth, Vietnam may need to focus on:

  • Enhancing value-added manufacturing

  • Supporting domestic SMEs in exports

  • Diversifying export markets to reduce dependency on a few large economies

Overall, the Q1 export data affirms Vietnam’s position as a dynamic manufacturing hub in the global supply chain — and a strategic sourcing destination for international buyers.

April 11, 2025 0 comment
0 FacebookTwitterLinkedinWhatsapp
Vietnam Commodity Market Price

Vietnam Agriculture Price From April 3rd – 9th, 2025

by Henry Truong April 10, 2025
written by Henry Truong

Note: This price is the Vietnam domestic market price (Exchange rate April 2nd, 2025). Please contact us if you want to know the EXW, FOB, or CNF prices.

Source: Department of Industry and Trade or Department of Agriculture of provinces in Vietnam

CommodityTypeLowest Price (USD/Kg)Highest (USD/Kg)
TROPICAL FRUIT
Dragon FruitRed Flesh Dragon Fruit0.540.85
White Flesh Dragon Fruit0.350.54
JackfruitJackfruit0.500.74
PomeloNăm Roi Pomelo0.580.97
Green Skin Pomelo0.700.78
MangoKeo Mango0.140.27
Sweet Hoa Loc Mango1.161.55
CoconutGreen Siam Coconut0.410.70
Macapuno Coconut0.610.64
Dried Coconut1.471.74
BananaBanana0.540.66
PinapplePineapple0.160.30
LimesLimes0.190.27
Persian Lime0.430.47
AvocadoButter Avocado0.500.78
Booth Avocado0.971.36
034 Avocado0.971.55
Hass Avocado1.942.13
Pinkerton Avocado1.942.13
DurianMekong Delta
Premium Ri6 Durian2.402.91
Ri6 Durian (Bulk)1.241.55
Premium Monthong Durian3.954.26
Monthong Durian (Bulk)1.862.13
SPICE INDUSTRY
PepperPepper (Đắk Lắk Province)5.770.00
Pepper (Gia Lai Province)5.740.00
Pepper (Đắk Nông Province)5.770.00
Pepper (Bà Rịa - Vũng Tàu Province)5.770.00
Pepper (Bình Phước Province)5.770.00
Pepper (Đồng Nai Province)5.770.00
ChilliGoat Horn Chili0.851.74
GingerGinger0.781.55
PeanutPeanuts (Grade 1)1.940.00
Peanuts (Grade 2)1.820.00
Peanuts with Shell (Fresh)0.970.00
FOOD INDUSTRY
RiceSticky Rice0.810.85
Regular Rice0.600.62
Nàng Nhen Rice1.090.00
Thai Fragrant Long Grain Rice0.780.85
Jasmine Fragrant Rice0.660.70
Hương Lài Rice0.850.00
Standard White Rice0.620.00
Nàng Hoa Rice0.810.00
Regular Sóc Rice0.660.00
Thailand Rice0.780.00
Taiwanese Fragrant Rice0.780.00
Japanese Rice0.850.00
Bran0.310.35
CoffeeGreen Coffee Beans - Đắk Lăk Province (Bulk)4.570.00
Green Coffee Beans - Lâm Đồng Province (Bulk)4.500.00
Green Coffee Beans - Gia Lai Province (Bulk)4.570.00
Green Coffee Beans - Đắk Nông Province (Bulk)4.570.00
CornCorn0.200.35
TeaFresh Tea Bud (Seed)0.390.00
Fresh Tea Bud (Branch)0.470.00
Cashew nutWhite Cashew Kernel W2406.989.69
White Cashew Kernel W3206.5911.43
White Cashew Kernel W4505.048.33
Broken White Cashew Kernel WS5.708.14
Macadamia nutFresh Macadamia - Đăk Lăk Province2.713.49
Fresh Macadamia - Lâm Đồng Province2.603.49
Fresh Macadamia - Đắk Nông Province2.673.68
Fresh Macadamia - Bình Định Province2.914.65
Dried Macadamia - Đắk Lắk Province9.6913.95
Dried Macadamia - Lâm Đồng Province12.7913.95
Dried Macadamia - Đắk Nông Province12.4013.95
Cacao beansBulk Cocoa Bean2.332.52
Fermented Cocoa Bean Grade I2.642.75
Fermented Cocoa Bean Grade II3.223.29
Fermented Cocoa Bean Grade III3.493.64
Fresh Cocoa Bean Price0.240.25
Pure Cocoa Powder5.436.98

See more:

  • Vietnam Agriculture Price From March 27th – April 2nd, 2025
  • Vietnam Agriculture Price From March 19th – 26th, 2025
  • Vietnam Agriculture Price From March 12th – 18th, 2025
  • Vietnam Agriculture Price From March 5th – 11th, 2025
  • Vietnam Agriculture Price From February 27th – March 4th, 2025

April 10, 2025 0 comment
0 FacebookTwitterLinkedinWhatsapp
Newer Posts
Older Posts

Recent Posts

  • Import Vietnamese Coffee: Your Strategic B2B Playbook
  • Vietnam’s Coffee Economy: Market Trends, Export, and Sustainable Future
  • Vietnamese Coffee Brands: Your Definitive Guide to Authentic Flavors, Top Picks & Smart Buying
  • Vietnamese Coffee Taste: Your Sensory Guide to Bold Flavors
  • Vietnamese Coffee: Ultimate Guide to History, Brews & Global Impact

Follow Us

Facebook Linkedin Twitter

Recent Posts

  • Import Vietnamese Coffee: Your Strategic B2B Playbook

    December 17, 2025
  • Vietnam’s Coffee Economy: Market Trends, Export, and Sustainable Future

    December 15, 2025
  • Vietnamese Coffee Brands: Your Definitive Guide to Authentic Flavors, Top Picks & Smart Buying

    December 13, 2025
  • Vietnamese Coffee Taste: Your Sensory Guide to Bold Flavors

    December 12, 2025
  • Vietnamese Coffee: Ultimate Guide to History, Brews & Global Impact

    December 11, 2025

Categories

  • Food & Spicy Industry (30)
  • Free Trade Agreement (18)
  • Fruit & Vegetable (56)
  • Garment & Footwear (11)
  • Market Insights (29)
  • Others (4)
  • Seafood (4)
  • Vietnam Commodity Market Price (17)
  • Vietnam Export Data (15)
  • Vietnam Market (6)
  • Wood & Furniture (19)

Vietnam Commodity Export offers comprehensive and in-depth information on Vietnam’s sourcing market, highlighting opportunities and challenges across various industries. We help international businesses find quality manufacturers and reliable suppliers in Vietnam, providing the critical insights needed to connect with the best partners and resources in the market.

Newsletter Subscribe
    • Homepage
    • Market Insight
    • Sourcing Service
    • Vietnam Overview
    • Publication
    • About Us
    • Contact Us
  • Product Catalogue
    • Coconut Products
    • Tropical Fruits
    • Spicy Products
    • Food & Nuts Products
    • Dried Fruit

You are looking for suppliers in Vietnam!

Shop Now
Facebook Linkedin Twitter Email
VNCOMMEX Group Co. Ltd Address: 06 Vo Van Kiet, Nguyen Thai Binh Ward, District 1, HCMC
Email: info@vncommex.com

All rights reserved. Designed and developed by Vietnam Commodity Exports

Privacy Policy

FAQ

VnCommEx
  • VCE
  • Product Catalogue
  • Market Insight
    • Wood & Furniture
    • Garment & Footwear
    • Food & Spicy Industry
    • Fruit & Vegetable
    • Others
    • Market Insights
  • Vietnam Market
    • Vietnam Commodity Market Price
    • Vietnam Export Data
    • Vietnam in FTA
  • Publication
  • About Us
  • English
    • 中文 (中国)
    • Tiếng Việt
VnCommEx
  • VCE
  • Product Catalogue
  • Market Insight
    • Wood & Furniture
    • Garment & Footwear
    • Food & Spicy Industry
    • Fruit & Vegetable
    • Others
    • Market Insights
  • Vietnam Market
    • Vietnam Commodity Market Price
    • Vietnam Export Data
    • Vietnam in FTA
  • Publication
  • About Us
  • English
    • 中文 (中国)
    • Tiếng Việt
@2021 - All Right Reserved. Designed and Developed by PenciDesign
✕

Shopping Cart

Close
No products in the cart.
Close
 
Return to shop