

Explore more in-depth publications from Vietnam Commodity Exports – featuring market analysis, trade trends, and strategies for key sectors like coffee, cashew, and fruit. Updated data and bilingual content designed for exporters and global investors.

Market Size: Numbers Reveal a Global “Thirst” for Coffee
Let’s start with a staggering fact: over 2.25 billion cups of coffee are consumed every single day across the globe. That amounts to nearly 400 billion cups per year — an undeniable testament to coffee’s deep-rooted presence in everyday life.
In terms of value, the global coffee market revenue surpassed USD 245.2 billion in 2024, marking a significant milestone for the industry. Yet this figure appears to be only the beginning of a remarkable growth journey. With a stable Compound Annual Growth Rate (CAGR) of 4.72%, experts project the market will expand dramatically to reach USD 365.02 billion by 2033. This sustained growth signals not only the immense potential but also the enduring vitality of the coffee industry — one of the world’s oldest global trades.
A World That “Drinks Up” Every Bean Produced
What drives this irresistible demand? Let’s examine the supply-demand balance:
Production: In the 2024/2025 crop year, global coffee production is forecast to reach 174.9 million 60-kg bags, an increase of 6.9 million bags compared to the previous season.
Consumption: Over the same period, global consumption is set to hit 168.1 million bags, rising by 5.1 million bags.
What’s truly remarkable is that only about 10 million bags are expected to be held in reserve — the lowest stock level since 2018. This small buffer, when compared to the massive demand, reveals a stark truth: the world is virtually consuming every bean it produces. Demand shows no signs of slowing down — in fact, it’s projected to rise steadily, especially as the global middle class and knowledge workforce continue to grow. As mental workload increases, people are increasingly turning to coffee’s stimulating effects to stay alert. The more pressure they face, the more coffee they consume.
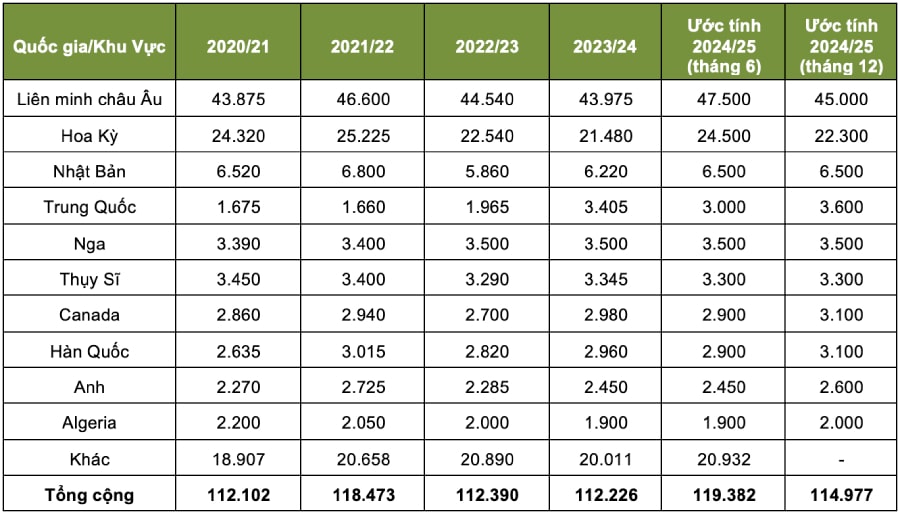
Green Coffee Bean Imports by Country/Region: Volume and Value Insights
The global green coffee bean import market is a multi-billion-dollar industry, with the European Union and the United States standing out as the two largest importers. Notably, inter-producer trade — the exchange of green beans between coffee-producing countries — also plays a significant role, accounting for approximately 7% of total global coffee exports, according to the International Coffee Organization (ICO).
Within this intra-industry trade:
Green Robusta beans dominate with 59% share (nearly 5 million bags) of the volume traded between producers.
Beans destined for instant coffee production account for 21% (about 1.7 million bags).
Arabica beans make up the remaining 19%.
Geographic Production Breakdown:
South America contributes 41% of global coffee output.
Southeast Asia follows with 27%.
Africa accounts for 17%.
Central America produces about 10%.
This concentration of production in specific regions results in a heavy economic dependence on coffee exports for many producing nations. As such, they remain highly vulnerable to unpredictable global market shifts — including fluctuations in prices, changes in consumption patterns, and broader geopolitical or economic developments.
Vietnam’s Coffee Export Performance (2020–2024)
Vietnam’s agricultural economy relies heavily on strategic export commodities like pepper, cashew, and especially coffee. As of 2024, Vietnam maintains its position as the world’s second-largest coffee exporter, trailing only Brazil. The country commands approximately 19%–21% of global market share, and holds the top spot as the leading producer of Robusta coffee worldwide.
Coffee is a vital pillar of Vietnam’s rural economy, supporting over 600,000 farming households and engaging around 2.6 million workers across the coffee value chain — equivalent to 4.8% of the country’s working-age population. This labor-intensive sector plays a critical role in job creation, income generation, and socio-economic stability in many highland regions.
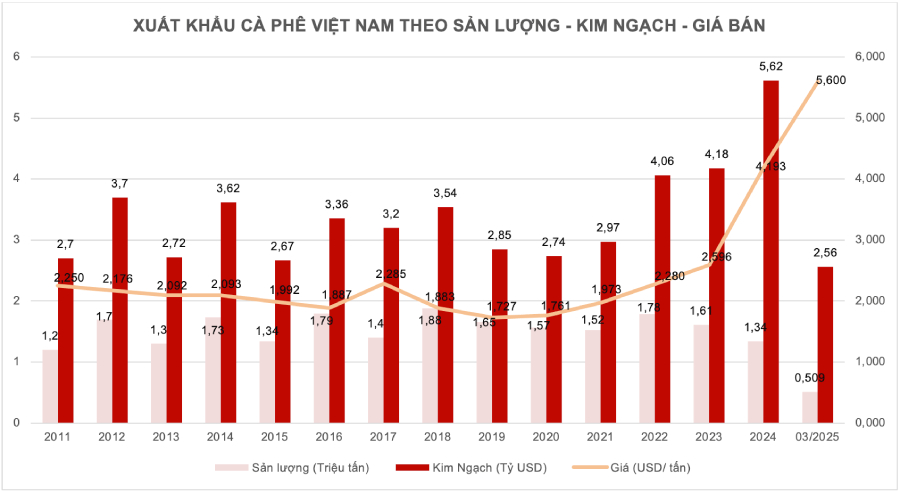
Figure 3: Vietnam’s Coffee Export Performance (2011 – March 2025) (Source: General Department of Customs, Vietnam)
From 2020 to 2024, Vietnam’s coffee export value nearly doubled, rising from USD 2.97 billion to USD 5.62 billion — a significant 84.5% increase. This growth was primarily driven by surging global coffee prices, even though export volumes fluctuated due to seasonal crop yields.
Key Milestones by Year:
2020–2021:
- Export value: USD 2.97 billion
- Volume: 1.52 million tons
- Year-over-year value ↑ 9.4%, volume ↓ 2.7%
2021–2022:
- Value hit a new record: USD 4.06 billion
- Growth in both volume and unit price
2022–2023:
- Volume declined 9.5% to approx. 1.61 million tons
- Average export price surged 15.5% to USD 2,596/ton
- Export value still grew to USD 4.18 billion
2023–2024:
- Historic high of USD 5.62 billion
- Robusta prices surpassed USD 4,193/ton, boosting revenue
- Volume dropped 18.8%, but value soared 29.1%
Vietnam’s Major Coffee Export Markets
Vietnam’s coffee exports are geographically diversified, but five key markets dominate:
EU: Largest destination, benefiting from EVFTA preferential tariffs
United States: High demand for Robusta in instant and specialty blends
Japan: Focus on quality; stable demand for processed coffee
Russia: Emerging buyer, increased purchases during price spikes
South Korea: Consistent importer driven by high instant coffee consumption
Vietnam’s competitive pricing and Robusta dominance continue to strengthen its position in both traditional and new markets.
Main Export Markets of Vietnamese Coffee
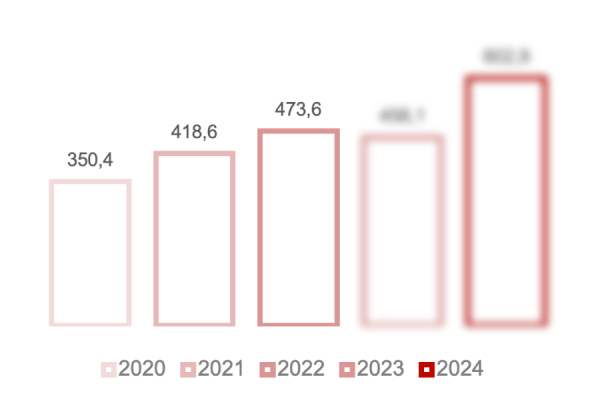 Figure 6: Vietnam’s Coffee Export Value to Germany (Unit: Million USD)
Germany – Vietnam’s Key Strategic Partner
From 2020 to 2024, Vietnam’s coffee exports to Germany surged from USD 350 million to nearly XXX million, marking an impressive growth of over 72%. As Europe’s largest coffee-consuming market, Germany maintains a stable demand, with a strong emphasis on sustainably produced and high-quality coffee. For many consecutive years, Germany has consistently been Vietnam’s largest coffee export market.
 Figure 11: Vietnam’s Coffee Export Value to the United States (Unit: Million USD)
United States – A Large But Highly Competitive Market
Vietnam’s coffee exports to the U.S. saw steady growth from USD 254.9 million in 2020 to XXX.X million in 2024, an increase of approximately 27%. As the world’s largest coffee consumer, the U.S. is showing an increasing preference for Robusta beans, especially in the production of ready-to-drink (RTD) and instant coffee products — presenting a strategic opportunity for Vietnam to expand its market share.
However, the potential imposition of higher tariffs on Vietnamese coffee by the U.S. starting mid-2025 poses a major challenge. It could raise product prices, reduce price competitiveness, and weaken Vietnam’s position relative to other key suppliers such as Brazil, Colombia, and Mexico.
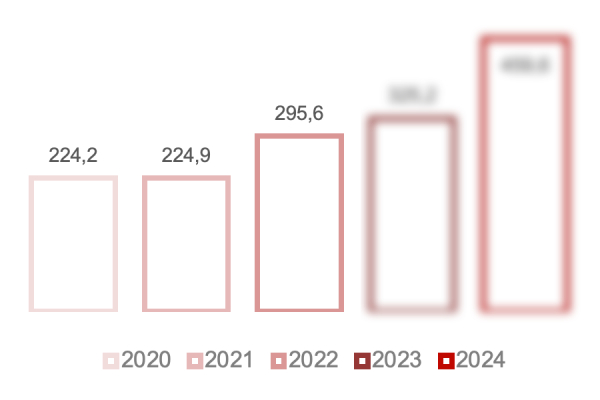 Figure 7: Vietnam’s Coffee Export Value to Italy (Unit: Million USD)
Italy – A Key Market for Coffee Blending
Vietnam’s coffee export turnover to Italy more than doubled, rising from USD 224 million in 2020 to XXX million in 2024, with a total volume of 127,724 tons. In just the first two months of 2025, exports continued their strong momentum, reaching USD 171 million, a 31% increase year-on-year. Vietnam’s coffee prices in the Italian market also reached premium levels. In March 2025, the average import price hit X,XXX USD/ton, approximately 10% higher than the average price of other supplying countries.
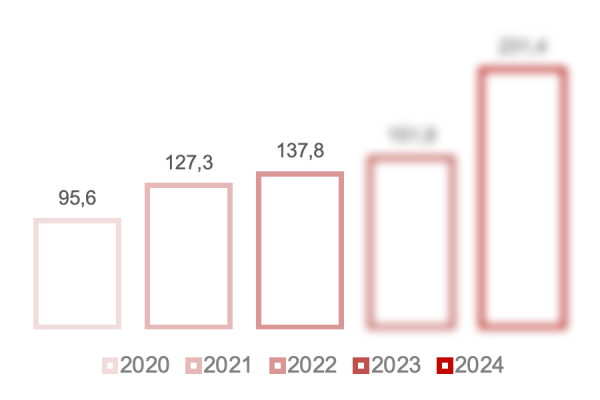 Figure 13: Vietnam’s Coffee Export Value to China (Unit: Million USD)
China – A Rapidly Growing Market
Vietnam’s coffee exports to China grew significantly, from USD 95.6 million in 2020 to XXX.X million in 2024. China has emerged as a fast-growing coffee market, with an annual growth rate exceeding 10%, driven by the expanding middle class and the rising popularity of coffee culture, particularly among the youth. This offers tremendous opportunities for Vietnam to boost exports, especially in high-quality Arabica and premium instant coffee segments.
However, domestic competition is also intensifying, with the rise of locally produced brands such as Yunnan coffee, alongside increasing demands for quality standards and import compliance procedures.
Coffee Production Costs & Profitability in Vietnam
Around 80%–90% of Vietnam’s coffee cultivation area is managed by smallholder farmers with less than 2 hectares, making the production system heavily reliant on traditional practices, manual labor, and chemical inputs such as fertilizers.
For both small- and medium-scale farms, the majority of production costs are concentrated in agricultural inputs (fertilizers, irrigation, pesticides) and labor. The high use of chemical fertilizers combined with limited adoption of mechanization or modern technologies keeps production costs elevated. In recent years, the volatility in input prices and wages has further increased total cultivation costs, putting pressure on farmers—especially during periods of low coffee prices.
Smallholders (<1 ha):
Small farms often rely on family labor to minimize hired labor costs, with hired labor accounting for XX.XX% of total costs—or even 0% if no external labor is used. NPK fertilizers represent the largest cost component (XX.XX%), followed by organic and livestock manure (X.XX% each), highlighting the central role of agro-inputs in overall production expenses. Other items like pesticides, irrigation, and depreciation account for less than XX% of the cost structure. This approach allows better cost control but may limit productivity due to insufficient investment in machinery and technical upgrades.
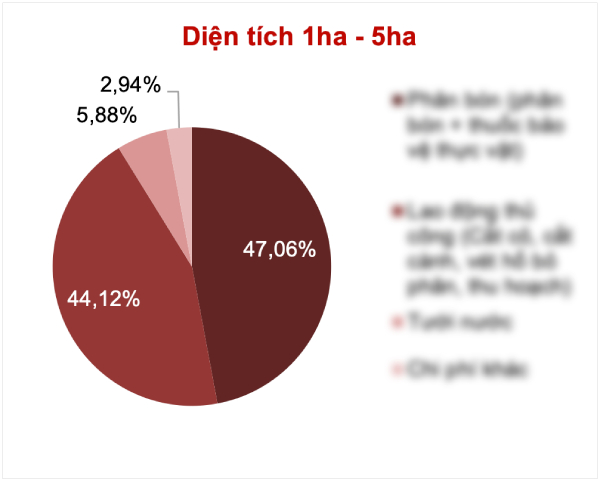
Medium to Large Farms (≥1 ha):
At larger scales, farms typically need to hire additional labor, especially during harvest, causing labor costs to account for a significantly higher share of total costs (e.g., harvesting alone may represent up to XX.XX%). Fertilizer remains the largest expense, at approximately XX.XX%, similar to smaller farms. However, absolute costs for irrigation, weeding, and pruning are also higher due to the increased area, even though their relative shares may range from X% to X%.
Vietnam’s coffee production cost structure remains relatively fixed, but there is substantial potential for optimization, particularly through:
- Sustainable agricultural practices
- Reduced dependence on chemical fertilizers
- Stronger integration into value chains
These improvements can help enhance economic returns and resilience for Vietnamese coffee growers.

